
The Illusion Of Prosperity
For the last 50 years, the consumer, that means you and me, have been the most powerful force driving the U.S. economy. Household spending now accounts for almost 70% of economic growth, about 10% more than it did in 1971. Household spending in the U.S. is also approximately 10-15% higher than most other developed nations.
Currently, U.S. economic growth is anemic and still suffering from the after-shocks of the financial crisis. Importantly, much of that weakness is the result of growing stress on consumers.Using the compelling graph below and the data behind it, we can illustrate why the U.S. economy and consumers are struggling.
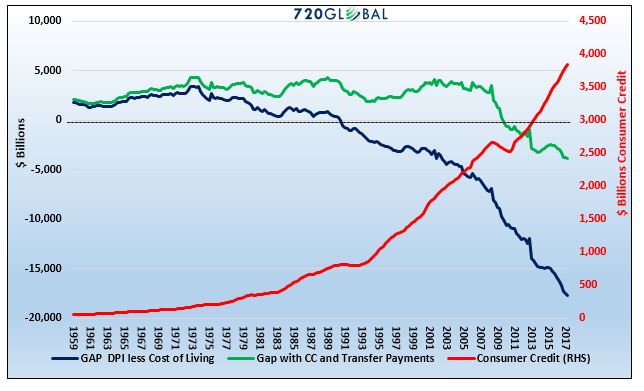
The blue line on the graph above marks the difference between median disposable income (income less taxes) and the median cost of living.A positive number indicates people at the median made more than their costs of living. In other words, their income exceeds the costs of things like food, housing, and insurance and they have money left over to spend or save. This is often referred to as “having disposable income.”If the number in the above calculation is negative, income is not enough to cover essential expenses.
From at least 1959 to 1971, the blue line above was positive and trending higher. The consumer was in great shape. In 1971 the trend reversed in part due to President Nixon’s actions to remove the U.S. dollar from the gold standard. Unbeknownst to many at the time, that decision allowed the U.S. government to run consistent trade and fiscal deficits while its citizens were able to take on more debt. Other than rampant inflation, there were no immediate consequences. In 1971, following this historic action, the blue line began to trend lower.
By 1990, the median U.S. citizen had less disposable income than the median cost of living; i.e., the blue line turned negative. This trend lower has continued ever since. The 2008 financial crisis proved to be a tipping point where the burden of debt was too much for many consumers to handle. Since 2008 the negative trend in the blue line has further steepened.
You might be thinking, if incomes were less than our standard of living, why did it feel like our standard of living remained stable?
One word – DEBT.
To help answer that question, we added the green line to the chart. This line adds consumer credit and transfer payments to the blue line. Consumer credit encompasses credit cards, lines of credit, auto loans, student loans, and other non-mortgage forms of consumer debt. Transfer payments are benefits the government bestows upon its citizens in which no goods or services are received in return. Examples include: welfare, food stamps, insurance, and medical benefits. It is important to note that, given the continual deficits run by the U.S. government, these benefits are predominately paid for with borrowed funds.
Note that the green line, unlike the blue line, remains positive and relatively stable from 1959 to 2008, 20 years longer than the blue line. The take away is that consumer and government debt filled the diverging gap between incomes and the cost of living.
The divergence between the lines halted in 2008. The financial crisis was in part the result of a consumer that had exhausted their ability to use more debt to maintain their lifestyle. Despite the lowest interest rates on record and increases in government transfer payments, the green line has not been able to recover.
The red line in the graph isolates the hockey-stick-like growth of consumer credit since the early 1990’s that was used to maintain our standard of living. Of importance, in 1990 when the blue line went negative, the pace of consumer credit growth accelerated. Since then the pace of credit growth has risen at a much faster rate than the economy and our incomes.
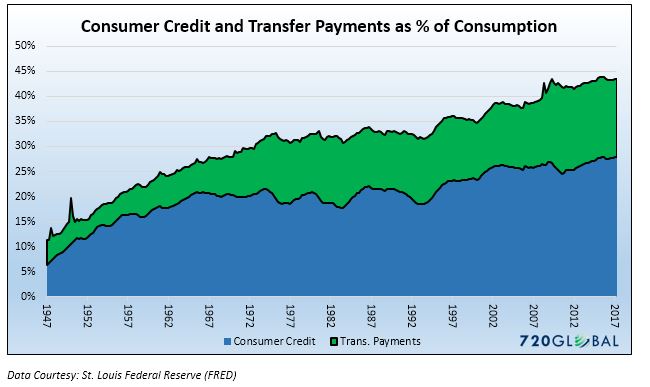
To impress upon you the importance of understanding the role debt has played in supporting our lifestyles, the graph below highlights the magnitude and composition of consumer credit and government transfer payments as a percentage of consumer spending. Combined they now account for 43% of all consumer spending, which in turn accounts for nearly 70% of economic growth. In other words, almost a third of economic growth is reliant on increasing debt.
Summary
These charts clearly illustrate that the U.S. consumer has steadily relied on increasing amounts of debt to maintain an artificial standard of living. Through the use of credit, personal and government, U.S. households have pulled forward future consumption. The weight of those outstanding obligations serves as a wet blanket on current and future economic growth.
The financial crisis in 2008 fractured the economy in ways that are clearly evident today. Addressing the troubling debt burden has been postponed through extraordinary stimulus, but the problem has only grown in size. This proves that a debt problem cannot be solved by using more debt.
Special thank you to Lance Roberts at Real Investment Advice for providing data and the concept behind this presentation.
720 Global is ...
more

