
MacroView: Debt, Deficits & The Path To MMT
In September 2017, when the Trump Administration began promoting the idea of tax cut legislation, I wrote a series of articles discussing the fallacy that tax cuts would lead to higher tax collections, and a reduction in the deficit. To wit:
“Given today’s record-high levels of debt, the country cannot afford a deficit-financed tax cut. Tax reform that adds to the debt is likely to slow, rather than improve, long-term economic growth.
The problem with the claims that tax cuts reduce the deficit is that there is NO evidence to support the claim. The increases in deficit spending to supplant weaker economic growth has been apparent with larger deficits leading to further weakness in economic growth. In fact, ever since Reagan first lowered taxes in the ’80’s both GDP growth and the deficit have only headed in one direction – higher.”
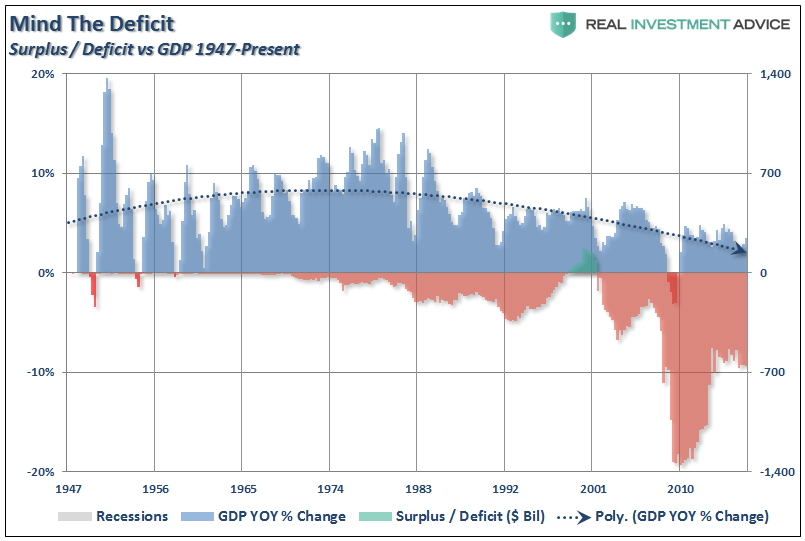
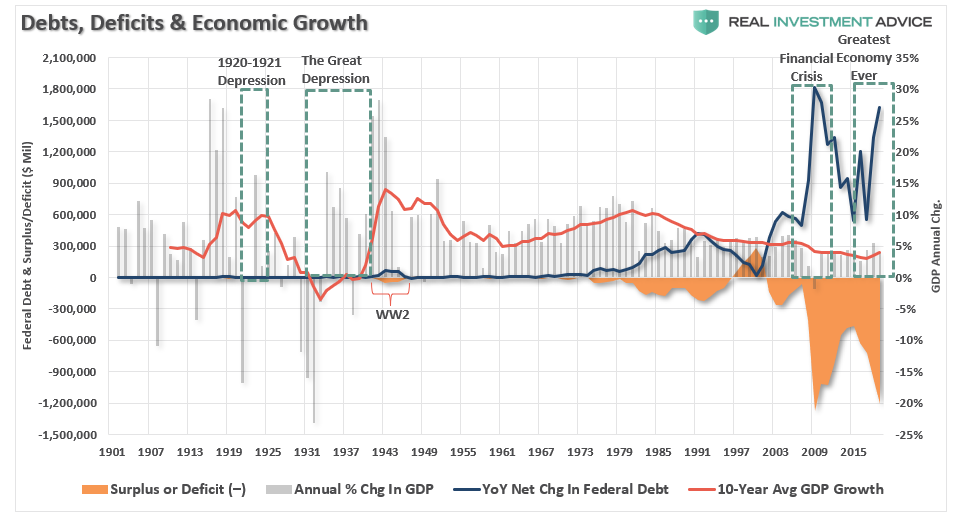
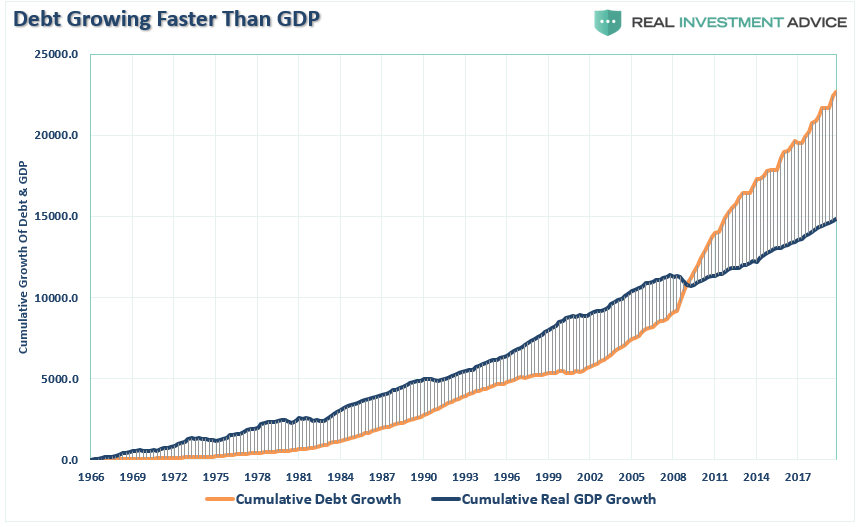
That was the deficit in September 2017.
Here it is today.
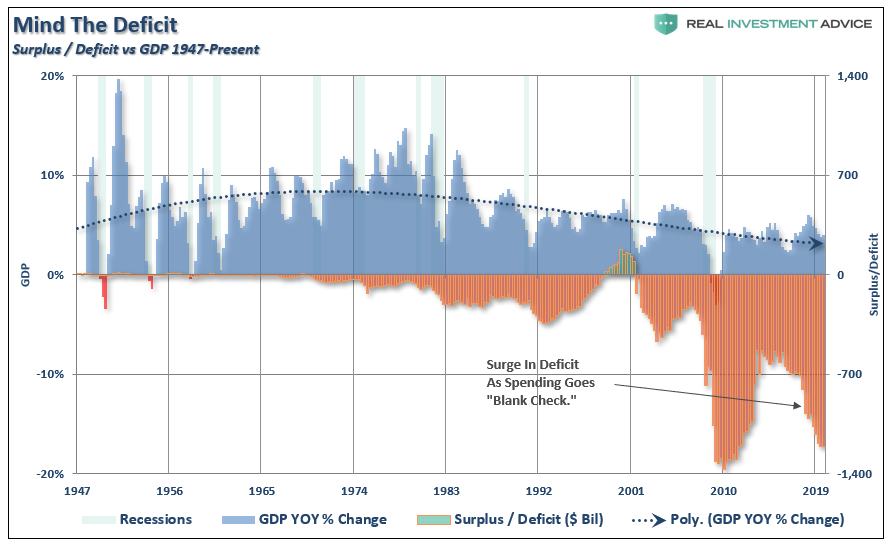
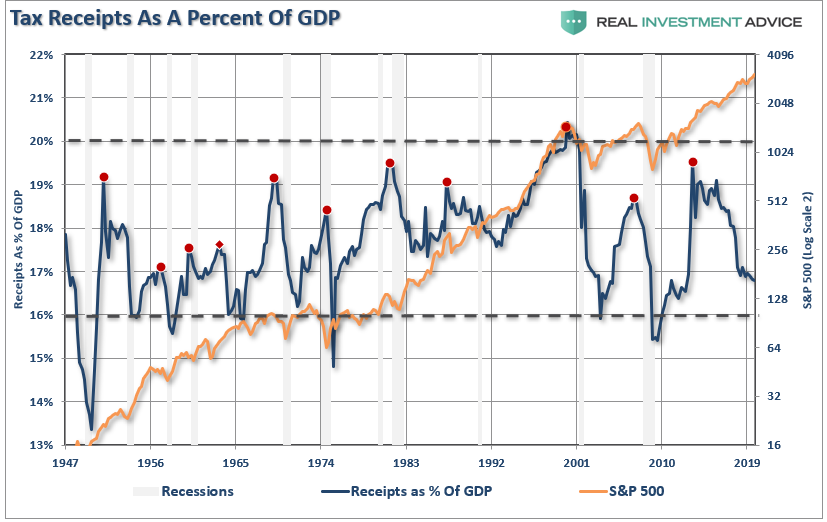
As opposed to all the promises made, economic growth failed to get stronger. Furthermore, federal revenues as a percentage of GDP declined to levels that have historically coincided with recessions.
Why Does This Matter?
President Trump just proposed his latest $4.8 Trillion budget, and not surprisingly, suggests the deficit will decrease over the next 10-years.
Such is a complete fantasy and was derived from mathematical gimmickry to delude voters to the contrary. As Jim Tankersley recently noted:
The White House makes the case that this is affordable and that the deficit will start to fall, dropping below $1 trillion in the 2021 fiscal year, and that the budget will be balanced by 2035. That projection relies on rosy assumptions about growth and the accumulation of new federal debt — both areas where the administration’s past predictions have proved to be overconfident.
The new budget forecasts a growth rate for the United States economy of 2.8 percent this year — or, by the metric the administration prefers to cite, a 3.1 percent rate. That is more than a half percentage point higher than forecasters at the Federal Reserve and the Congressional Budget Office predict.
It then predicts growth above 3 percent annually for the next several years if the administration’s economic policies are enacted. The Fed, the budget office and others all see growth falling below 2 percent annually in that time. By 2030, the administration predicts the economy will be more than 15 percent larger than forecasters at the budget office do.
Past administrations have also dressed up their budget forecasts with economic projections that proved far too good to be true. In its fiscal year 2011 budget, for example, the Obama administration predicted several years of growth topping 4 percent in the aftermath of the 2008 financial crisis — a number it never came close to reaching even once.
Trump’s budget expectations also contradict the Congressional Budget Office’s latest deficit warning:
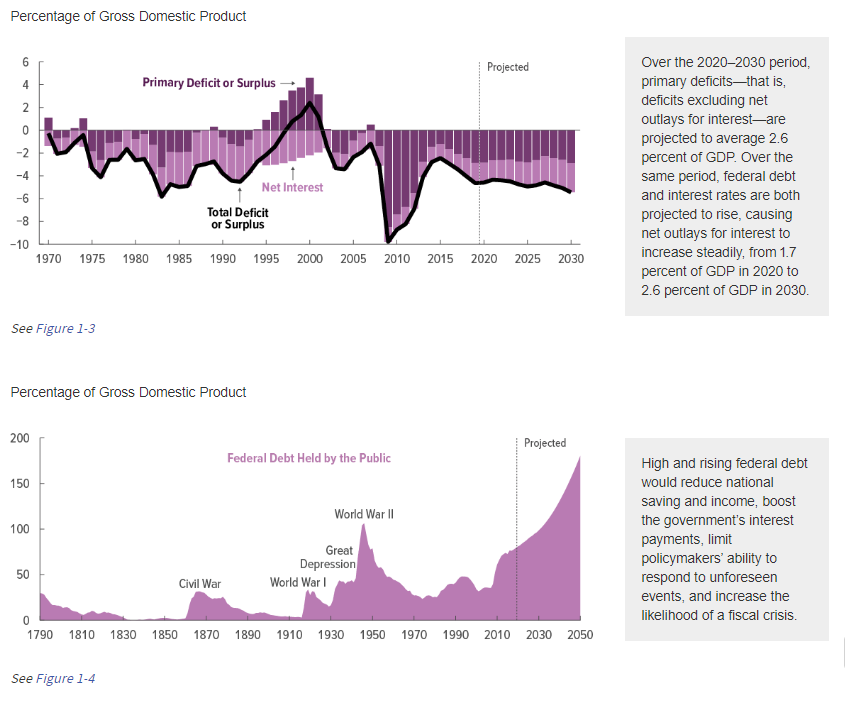
“CBO estimates a 2020 deficit of $1.0 trillion, or 4.6 percent of GDP. The projected gap between spending and revenues increases to 5.4 percent of GDP in 2030. Federal debt held by the public is projected to rise over the coming decade, from 81 percent of GDP in 2020 to 98 percent of GDP in 2030. It continues to grow thereafter in CBO’s projections, reaching 180 percent of GDP in 2050, well above the highest level ever recorded in the United States.”
“With unprecedented trillion-dollar deficits projected as far as the eye can see, this country needs a serious budget. Unfortunately, that cannot be said of the one the President just submitted to Congress, which is filled with non-starters and make-believe economics.” – Maya Macguineas
Debt Slows Economic Growth
There is a long-standing addiction in Washington to debt. Every year, we continue to pile on more debt with the expectation that economic growth will soon follow.
However, excessive borrowing by companies, households or governments lies at the root of almost every economic crisis of the past four decades, from Mexico to Japan, and from East Asia to Russia, Venezuela, and Argentina. But it’s not just countries, but companies as well. You don’t have to look too far back to see companies like Enron, GM, Bear Stearns, Lehman, and a litany of others brought down by surging debt levels and simple “greed.” Households, too, have seen their fair share of debt burden related disaster from mortgages to credit cards to massive losses of personal wealth.
It would seem that after nearly 40-years, some lessons would have been learned.
Such reckless abandon by politicians is simply due to a lack of “experience” with the consequences of debt.
In 2008, Margaret Atwood discussed this point in a Wall Street Journal article:
“Without memory, there is no debt. Put another way: Without story, there is no debt.
A story is a string of actions occurring over time — one damn thing after another, as we glibly say in creative writing classes — and debt happens as a result of actions occurring over time. Therefore, any debt involves a plot line: how you got into debt, what you did, said and thought while you were in there, and then — depending on whether the ending is to be happy or sad — how you got out of debt, or else how you got further and further into it until you became overwhelmed by it, and sank from view.”
The problem today is there is no “story” about the consequences of debt in the U.S. While there is a litany of other countries which have had their own “debt disaster” story, those issues have been dismissed under the excuse of “yes, but they aren’t the U.S.”
But this lack of a “story,” is what has led us to the very doorstep of “Modern Monetary Theory,” or “MMT.” As Michael Lebowitz previously explained:
“MMT theory essentially believes the government spending can be funded by printing money. Currently, government spending is funded by debt, and not the Fed’s printing press. MMT disciples tell us that when the shackles of debt and deficits are removed, government spending can promote economic growth, full employment and public handouts galore.
Free healthcare and higher education, jobs for everyone, living wages and all sorts of other promises are just a few of the benefits that MMT can provide. At least, that is how the theory is being sold.”
What’s not to love?
Oh yes, it’s that deficit thing.
Deficits Are Not Self-Financing
The premise of MMT is that government “deficit” spending is not a problem because the spending into “productive investments” pay for themselves over time.
But therein lies the problem – what exactly constitutes “productive investments?”
For government “deficit” spending to be effective, the “payback” from investments made must yield a higher rate of return than the interest rate on the debt used to fund it.
Examples of such investments range from the Hoover Dam to the Tennessee River Valley Authority. Importantly, “infrastructure spending projects,” must have a long-term revenue stream tied to time. Building roads and bridges to “nowhere,” may create short-term jobs, but once the construction is complete, the economic benefit turns negative.
The problem for MMT is its focus on spending is NOT productive investments but rather social welfare which has a negative rate of return.
Of course, the Government has been running a “Quasi-MMT” program since 1980.
According to the Center On Budget & Policy Priorities, roughly 75% of every current tax dollar goes to non-productive spending. (The same programs the Democrats are proposing.)

To make this clearer, in 2019, the Federal Government spent $4.8 Trillion, which was equivalent to 22% of the nation’s entire nominal GDP. Of that total spending, ONLY $3.6 Trillion was financed by Federal revenues, and $1.1 trillion was financed through debt.
In other words, if 75% of all expenditures go to social welfare and interest on the debt, those payments required $3.6 Trillion, or roughly 99% of the total revenue coming in.
There is also clear evidence that increasing debts and deficits DO NOT lead to either stronger economic growth or increasing productivity. As Michael Lebowitz previously showed:
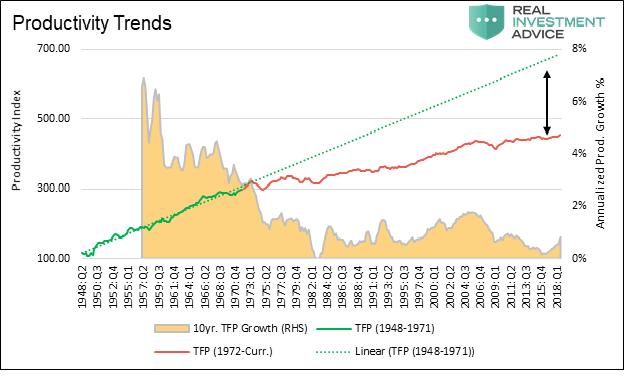
“Since 1980, the long term average growth rate of productivity has stagnated in a range of 0 to 2% annually, a sharp decline from the 30 years following WWII when productivity growth averaged 4 to 6%. While there is no exact measure of productivity, total factor productivity (TFP) is considered one of the best measures. Data for TFP can found here.
The graph below plots a simple index we created based on total factor productivity (TFP) versus the ten-year average growth rate of TFP. The TFP index line is separated into green and red segments to highlight the change in the trend of productivity growth rate that occurred in the early 1970’s. The green dotted line extrapolates the trend of the pre-1972 era forward.”
“The plot of the 10-year average productivity growth (black line) against the ratio of total U.S. credit outstanding to GDP (green line) is telling.”
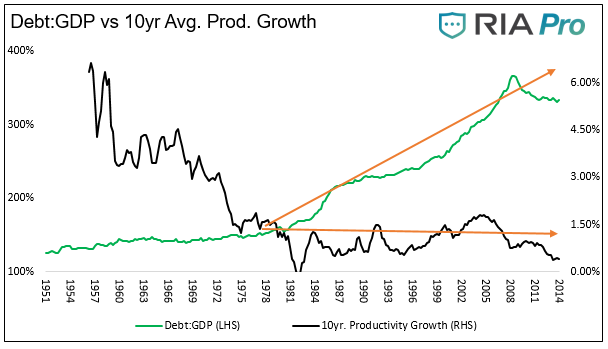
“This reinforces the message from the other debt-related graphs – over the last 30-years the economy has relied more upon debt growth and less on productivity to generate economic activity.
The larger the balance of debt has become, the more economically destructive it is by diverting an ever-growing amount of dollars away from productive investments to service payments.
Since 2008, the economy has been growing well below its long-term exponential trend. Such has been a consistent source of frustration for both Obama, Trump, and the Fed, who keep expecting higher rates of economic only to be disappointed.
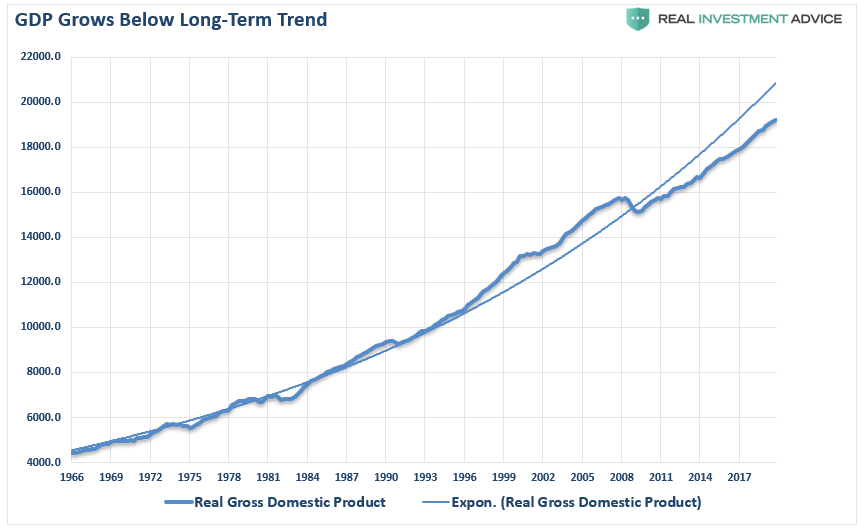
The relevance of debt growth versus economic growth is all too evident. When debt issuance exploded under the Obama administration and accelerated under President Trump, it has taken an ever-increasing amount of debt to generate $1 of economic growth.
Another way to view the impact of debt on the economy is to look at what “debt-free” economic growth would be. In other words, without debt, there has been no organic economic growth.
For the 30-years, from 1952 to 1982, the economic surplus fostered a rising economic growth rate, which averaged roughly 8% during that period. Today, with the economy expected to grow at just 2% over the long-term, the economic deficit has never been higher. If you subtract the debt, there has not been any organic economic growth since 1990.
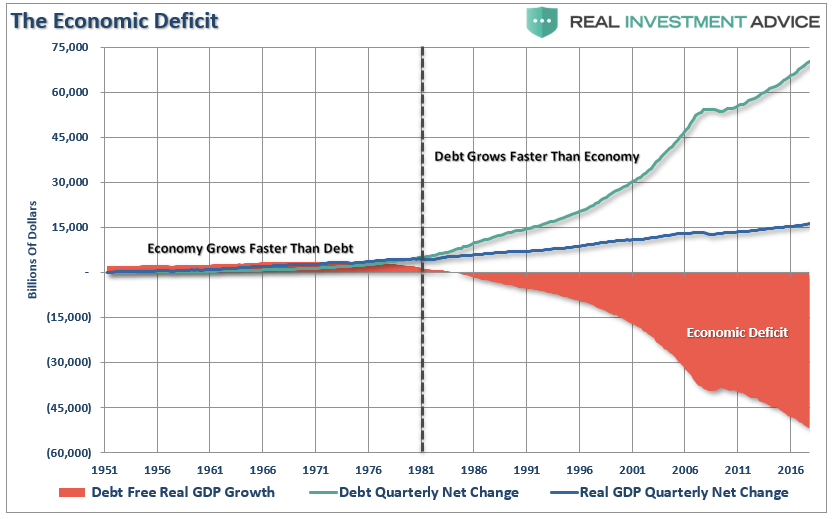
What is indisputable is that running ongoing budget deficits that fund unproductive growth is not economically sustainable long-term.
The End Game Cometh
Over the last 40-years, the U.S. economy has engaged in increasing levels of deficit spending without the results promised by MMT.
There is also a cost to MMT we have yet to hear about from its proponents.
The value of the dollar, like any commodity, rises and falls as the supply of dollars change. If the government suddenly doubled the money supply, one dollar would still be worth one dollar but it would only buy half of what it would have bought prior to their action.
This is the flaw MMT supporters do not address.
MMT is not a free lunch.
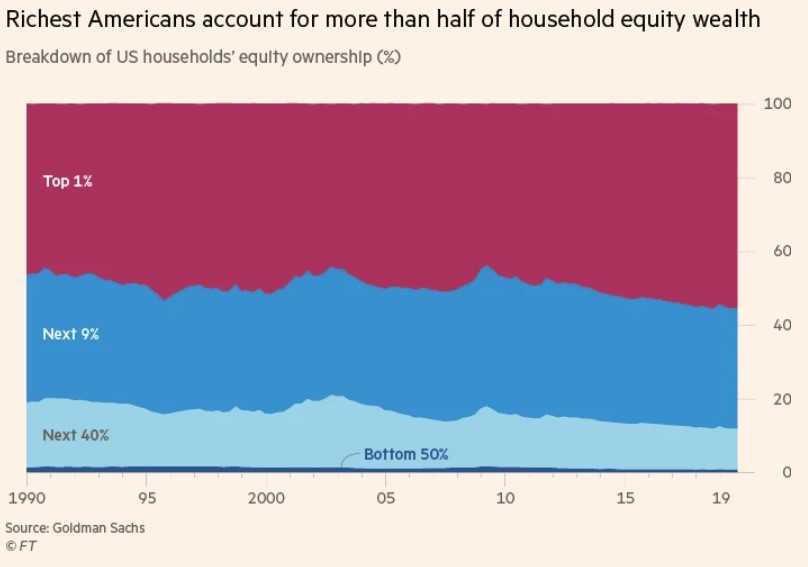
MMT is paid for by reducing the value of the dollar and ergo your purchasing power. MMT is a hidden tax paid by everyone holding dollars. The problem, as Michael Lebowitz outlined in Two Percent for the One Percent, inflation tends to harm the poor and middle class while benefiting the wealthy.
This is why the wealth gap is more pervasive than ever. Currently, the Top 10% of income earners own nearly 87% of the stock market. The rest are just struggling to make ends meet.
As I stated above, the U.S. has been running MMT for the last three decades and has resulted in social inequality, disappointment, frustration, and a rise in calls for increasing levels of socialism.
It is all just as you would expect from such a theory put into practice, and history is replete with countries that have attempted the same. Currently, the limits of profligate spending in Washington has not been reached, and the end of this particular debt story is yet to be written.
But, it eventually will be.
Disclaimer: Real Investment Advice is powered by RIA Advisors, an investment advisory firm located in Houston, Texas with more than $800 million under management. As a team of certified and ...
more

