
Interest Rate Projections
The CBO recently released long term projections for Federal budget variables, including debt. These projections rely upon the assumed path of interest rates. Here, there is considerable uncertainty. Figure 1 presents the 10 year Treasury yield, and CBO projections at various dates.
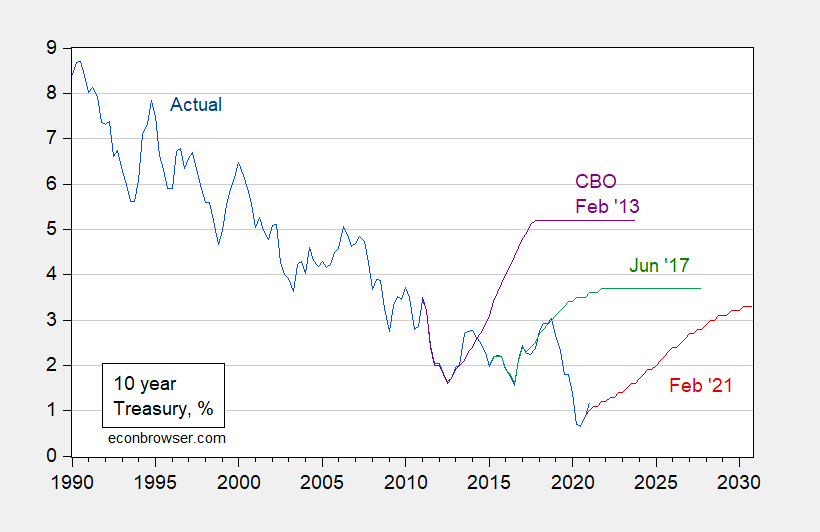
Figure 1: Ten year constant maturity Treasury yields (blue), CBO projection from February 2021 (red), from June 2017 (green), and from February 2013 (purple), all %. Quarterly data average of monthly, except for 2021Q1, which is average of January and February. Source: FRED, CBO, and author’s calculations.
Gamber (CBO, 2020) lays out the economic rationale for the projections (demographics, international forces, etc.). He notes:
Modeling and forecasting interest rates also presents many challenges that contribute to the uncertainty about the path of interest rates, especially over the long term. Three challenges, in particular, contribute to the uncertainty of the projected path of interest rates over the next 10 to 30 years. The first challenge is that it is difficult to measure and forecast independent movements in the various factors affecting interest rates. For example, the research literature identifies demographic changes as an important factor in determining interest rates. But demographics (the aging population and increased life expectancy) affect interest rates through a number of different channels—the saving rate, the labor force participation rate, and possibly the rate at which people discount the future. Forecasting the independent influences of those channels is challenging and contributes to the uncertainty in interest rate forecasts.
A second challenge with forecasting interest rates over the next 30 years is that the ratio of debt to GDP in the United States is projected to rise to unprecedented levels (Congressional Budget Office 2020a). The peak ratio of debt to GDP over the past 100 years—120 percent—was reached just after World War II. In CBO’s long-term budget projections, that ratio exceeds 200 percent. It is difficult to anticipate how the economy and financial markets might respond when the debt-to-GDP ratio reaches unprecedented levels. CBO’s method for forecasting interest rates implicitly reflects the assumption that historical relationships between rising debt and interest rates will remain unchanged as debt rises to those unprecedented levels. But if the increase in debt leads to an erosion of confidence in the United States’ ability to repay its debt or to an erosion of the dollar’s status as an international reserve currency, real interest rates could increase more than CBO anticipates. The challenge of modeling how the economy will respond to rising debt as it reaches unprecedented levels adds to the uncertainty of CBO’s interest rate forecast.
A third challenge with modeling and forecasting interest rates over the long term is separating temporary movements in interest rates from persistent or permanent movements. Over the past 150 years, real interest rates have been subject to sudden and persistent shifts (see Figure 4). A challenge with any forecasting method is to separate transitory from persistent shifts in interest rates. CBO addresses that challenge by choosing a historical benchmark period—1995 to 2004—over which the agency estimates monetary policy was neutral, on average.
The long-term decline in interest rates that occurred during the latter half of the benchmark period is interpreted as temporary rather than persistent and thus does not affect CBO’s projections of interest rates. CBO expects that interest rates would be the same from 2046 to 2050 as they were on average from 1995 to 2004 if during that projection period the values of the factors that are inputs into CBO’s projections equaled their averages over the 1995–2004 period. The difficulty in assessing whether omitted factors related to trends within the benchmark period would persist into the projection period contributes to the uncertainty of CBO’s projections.
By the way, predicting interest rates has been a challenging task for all sorts of forecasters. Consider Figure 5 from Gamber (2020), which show Blue Chip forecasts relative to real interest rate outcomes.
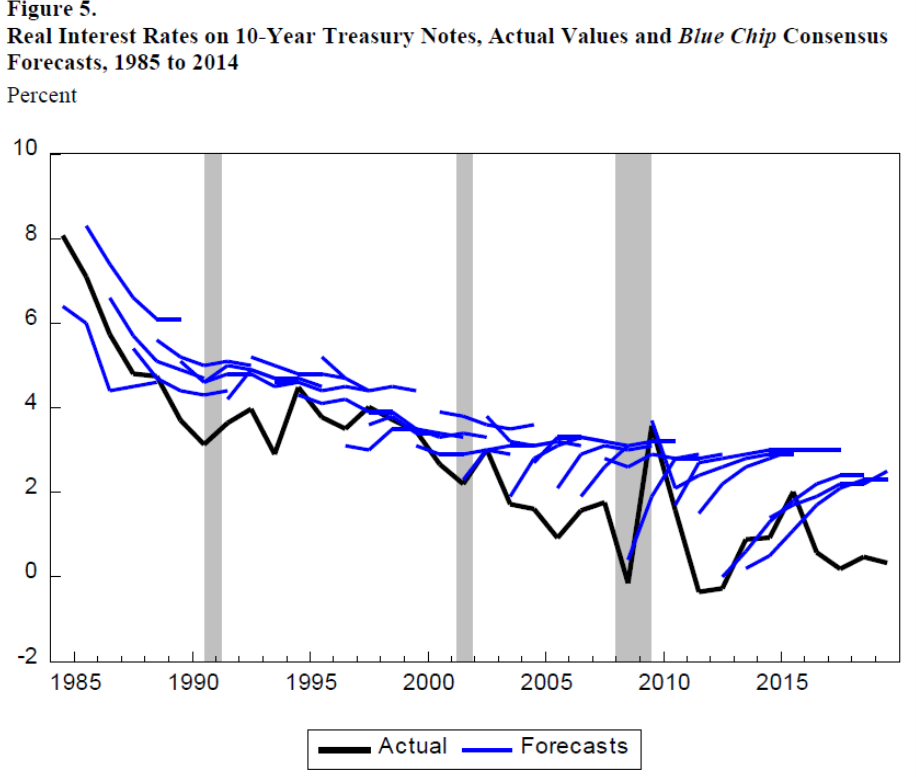
Source: Gamber (2020).
In other words, Blue Chip surveyed economists have on average been predicting mean reversion for the past 35(!) years.
Disclosure: None.


