
Fed VP Williamson Destroys Inflation Hawks
Inflation hawks have ratcheted up inflation expectations with limited results. They are like the guy whose ship came in while he was at the airport. They base inflation expectations on CPI when the Fed measures PCE. Dr Stephen Williamson destroyed the inflation hawks back in April of 2017, but most of the pundits were not paying attention.
The Consumer Price Index (CPI), measures the cost of living by measuring a pre-chosen basket of goods. The CPI includes everything, including food and energy. The Personal Consumption Expenditures (PCE) index does not include the cost of food and energy because they are volatile and change often. The Fed seeks to measure underlying inflation.
The Fed looks, as Dr Williamson has said, at PCE, not at CPI. And since the Fed looks at PCE, the St Louis Fed Vice President says inflation expectations based on CPI are not valid. By the time that the CPI reveals a bias against inflation, the watchers of PCE can say they already knew that was the case.
So, why are the pundits fooled? Well, it is because the Breakeven Inflation chart is based on CPI!
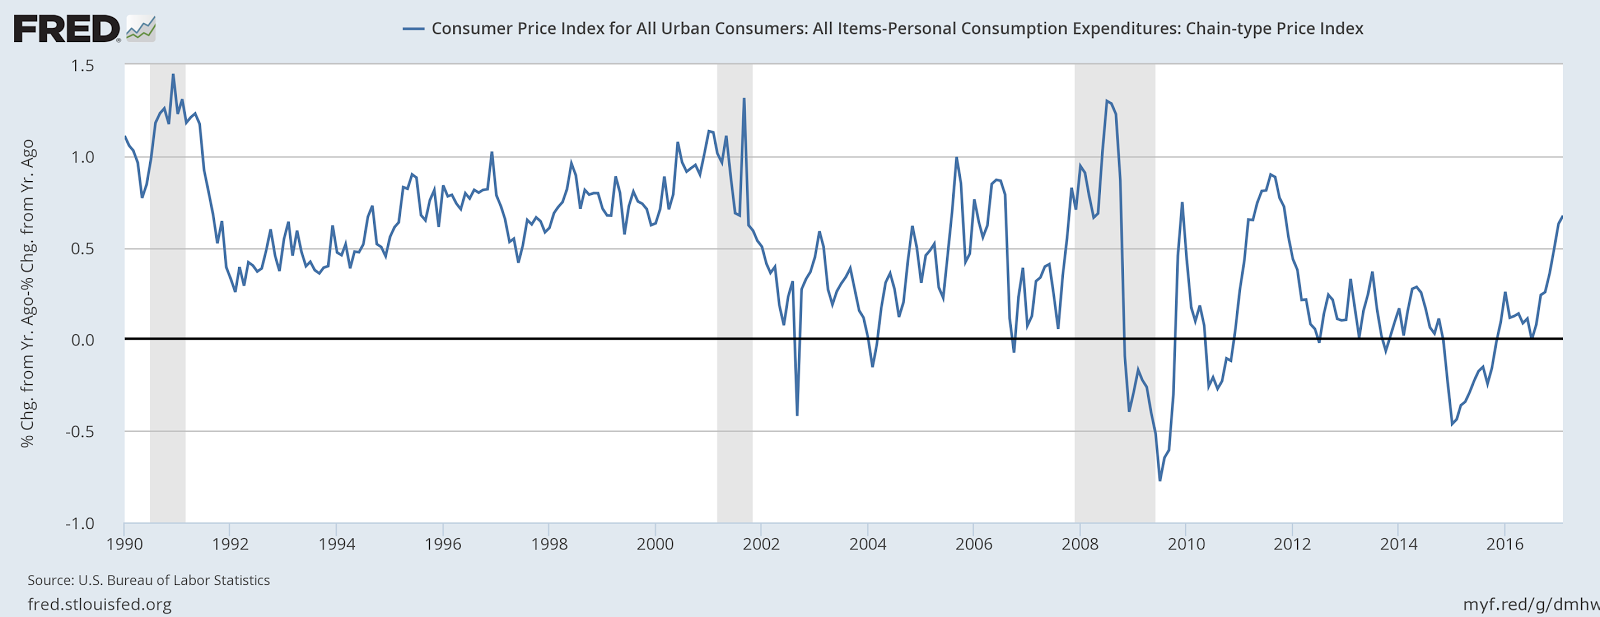 |
| FRED Chart Courtesy Dr Williamson |
We can see that this CPI chart, showing rate of change of inflation including food and energy showed a big spike. But it is an illusion if we listen to the Fed. The Breakeven chart shown below is based on this illusion:

Tips are based upon the Breakeven chart. People saw a spike in CPI inflation coming in 2016, thinking it would continue. But in fact, the Breakeven chart, according to Dr Williamson, is biased upward. Inflation has not reached its target much.
In 2016, as we see from the FRED chart below, PCE, the aqua colored line, climbed slowly, but diverged from CPI, the blue colored line, which exploded upward.
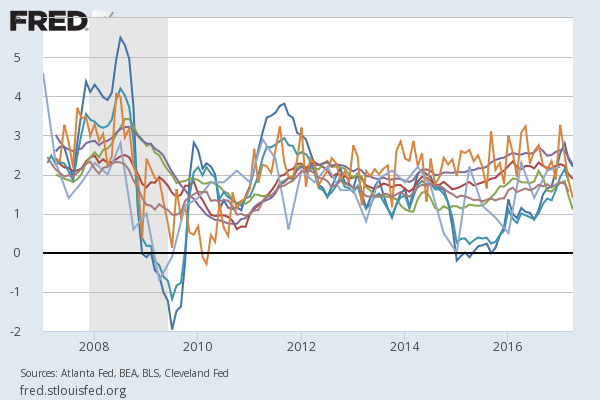 |
| The Many Measurements of Inflation |
Core inflation peaked at almost 3 percent while PEC topped out just above 2 percent. People staked their reputations and put their money on the bet inflation would explode. If you were on the burning platform pictured at the Burning Platform blog, well, you got burned.
The mania was significant, and bloggers failed to understand, in my opinion, that Money Velocity was dead in the water. People staked their inflation predicting reputations on the misguided notion that money velocity would take off. But nothing could be further from the truth. The chart doesn't lie. In 2017 we are below 1.45 for M2:

As long as money velocity chart looks this way, inflation seems like only a figment of the Inflationista's (Inflationists') Imaginations. The Inflationistas were wrong in 2010, when Krugman wrote about it. And they are wrong again in 2017. I want them to cry "uncle". But they won't. It is in their blood, apparently. Dr Williamson is a formidable opponent to these hawks and has shut them down.
Keep in mind that Dr Williamson buys into the truth that people hold bonds at lower rates than they would otherwise because they need the collateral. Dr Williamson says this in closing the article cited above. People should pay close attention to both paragraphs:
In conclusion, if low real interest rates persist, at the levels we have seen, then this should not be a problem for inflation control. The Fed can control inflation, albeit with a lower average level of short-term nominal interest rates than we have seen in the past. Potentially, problems could be encountered, not with inflation control, but in affecting real economic activity. Though neo-Fisherism says increases in the central bank's nominal interest rate target make inflation go up, these ideas do not suggest that an increase in the nominal rate makes output go up. The conventional notion that monetary stabilization policy is about reducing interest rates in the face of shocks that make output go down seems to be strongly supported by the data. Thus, if there is a problem for monetary policy in a low-real-interest-rate environment, it's that the nominal interest rate cannot fall enough in the face of a recession. Between mid-2007 and late 2008, the fed funds rate target fell from 5.25% to (essentially) zero. But, if the average fed funds rate is 3%, or 2%, it can't fall by 500 basis points or more in the event of a downturn.
But how do we know that historical Fed behavior was optimal, or even close to it? Standard New Keynesian theory says that, if the real interest rate is sufficiently low, then the nominal interest rate should go to zero. But in my paper, if we're explicit about the reasons for the low real interest rate - in this case a tight collateral constraint - then the low real interest rate implies that the nominal interest rate should go up. That is, a low real interest rate reflects an inefficiently low supply of safe collateral, and an open market sale by the central bank can mitigate the collateral shortage, which results in higher nominal and real interest rates.
I would just add that housing-as-a-commodity will possibly limit Dr Williamson's solution of higher rates, which does mitigate the collateral shortage, but won't help housing. Yes, banks will loosen up, but will people qualify and if they do will the Wall Street machine snatch the houses away from the middle class on a regular basis as is happening now? Or will house prices need to come down in the future?
Disclosure: I am not an investment counselor nor am I an attorney so my views are not to be considered investment advice. I have no financial interest in any company listed in this ...
more

