
Estimating Potential Output
Estimating potential output at CBO [Congressional Budget Office], is described in detail in this working paper. Also, here is a comparison of implied output gaps from various organizations, through 2016.
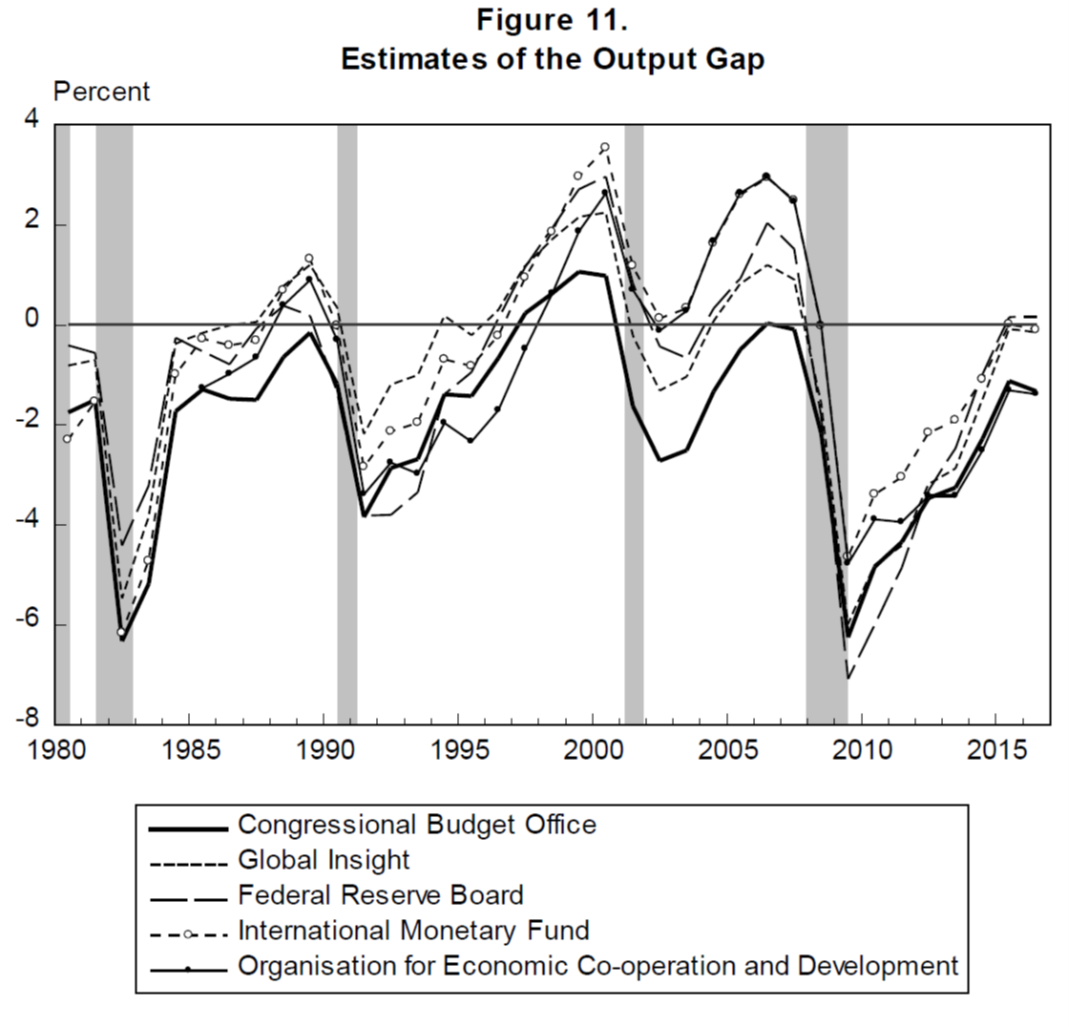
Source: Shackleton (2018).
Updated CBO projection here. Discussion of comparison to statistical filters in this post from a few days ago, which includes this graph:
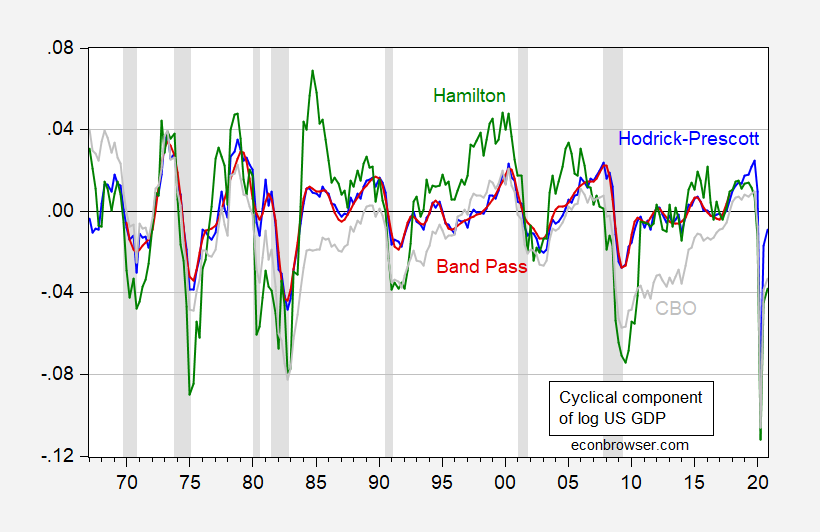
Figure 1: Cyclical component from Hodrick-Prescott filter (blue), from Baxter-King band pass filter (red), Hamilton filter (green), and output gap from CBO (gray), all in logs, estimated from 1967-2020 data. NBER defined recession dates shaded gray. Source: BEA 2020Q4 2nd release, CBO (February 2021), NBER, and author’s calculations.
A comparison of some other methods in an older Econbrowser post.
Disclosure: None.


