
BEA Revised 1st Quarter 2018 GDP Growth Downward To 2.17%
In their second estimate of the US GDP for the first quarter of 2018, the Bureau of Economic Analysis (BEA) reported that the US economy was growing at a +2.17% annual rate, down -0.15% from their previous estimate and down -0.71% from the prior quarter.
The growth rate for consumer spending for services was revised lower by -0.13%, which was accompanied by a nearly offsetting +0.11% improvement in consumer spending on goods. Similarly, the growth in inventories declined by -0.30% while the growth in commercial fixed investment rose by a counterbalancing +0.29%. The growth rates for both exports and imports weakened by an aggregate -0.12%.
Both real annualized household disposable income and the household savings rate were unchanged from the previous report. While the savings rate remained below recent norms, it was +0.5% better than the prior quarter -- which was the lowest level seen since the third quarter of 2007.
For this revision the BEA assumed an effective annualized deflator of 1.96%. During the same quarter (January 2018 through March 2018) the inflation recorded by the Bureau of Labor Statistics (BLS) in their CPI-U index was materially higher at 2.53%. Under estimating inflation results in optimistic growth rates, and if the BEA's "nominal" data was deflated using CPI-U inflation information the headline growth number would have been significantly lower at a +1.64% annualized growth rate.
Among the notable items in the report :
- Consumer expenditures for goods contracted at a -0.13% annualized rate (down -1.80% from the prior quarter).
- The contribution to the headline from consumer spending on services dropped -0.13% to +0.84%. The combined consumer contribution to the headline number was +0.71%, down over 2% (-2.04%) from 4Q-2017.
- The headline contribution from commercial private fixed investments was +1.05%, down -0.26% from the prior quarter.
- Inventories added +0.13% to the headline number. It is important to remember that the BEA's inventory numbers are exceptionally noisy (and susceptible to significant distortions/anomalies caused by commodity price or currency swings) while ultimately representing a zero reverting (and long term essentially zero sum) series.
- The growth in governmental spending was unchanged, adding +0.20% to the headline number (although that growth rate is down -0.31% from the prior quarter).
- Exports contributed +0.51% to the headline number, down -0.32% from the prior quarter.
- Imports subtracted -0.43% from the headline number, up +1.56% from the prior quarter. In aggregate, foreign trade boosted the headline number by +0.08%.
- The "real final sales of domestic product" growth was revised upward to +2.04%, although that growth was down a substantial -1.37% from the prior quarter. This is the BEA's "bottom line" measurement of the economy and it excludes the inventory data.
- As mentioned above, real per-capita annual disposable was unchanged in this report -- up $255 from a revised prior quarter. The household savings rate was reported to be 3.1% (up +0.5% from the prior quarter, but only half of the rate recorded for second quarter of 2015). As always, it is important to keep this line item in perspective: real per-capita annual disposable income is up only +7.68% in aggregate since the second quarter of 2008 -- a meager annualized +0.76% growth rate over the past 39 quarters.
The Numbers, As Revised
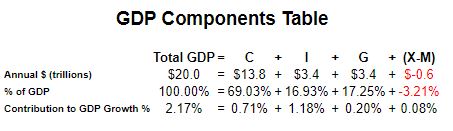
As a quick reminder, the classic definition of the GDP can be summarized with the following equation:
GDP = private consumption + gross private investment + government spending + (exports - imports)
or, as it is commonly expressed in algebraic shorthand: GDP = C + I + G + (X-M)
In the new report the values for that equation (total dollars, percentage of the total GDP, and contribution to the final percentage growth number) are as follows:
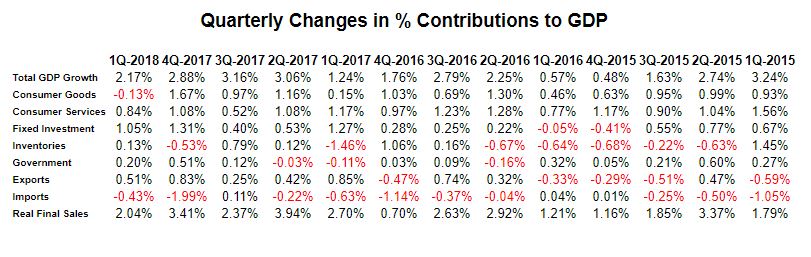
The quarter-to-quarter changes in the contributions that various components make to the overall GDP can be best understood from the table below, which breaks out the component contributions in more detail and over time. In the table below we have split the "C" component into goods and services, split the "I" component into fixed investment and inventories, separated exports from imports, added a line for the BEA's "Real Final Sales of Domestic Product" and listed the quarters in columns with the most current to the left:
(Click on image to enlarge)
Summary and Commentary
As mentioned last month, we need to be cautious about taking this set of downward revised numbers for the actual growth rate of the US economy. All of the BEA's especially noisy components are contributing to the headline number: inventories, imports and deflators. At key economic inflection points those three components can become closely coupled, with lagging price discovery compounding reported inventory and import swings.
The major takeaways from this report were :
- Consumer spending for goods was still reported to be contracting during the quarter, and the reported growth in services spending weakened materially.
- The overall annualized growth rate for consumer spending dropped over -2% on a quarter-to-quarter basis.
- Although household disposable income improved quarter-to-quarter (most likely due to the reduced withholding rates in the "Tax Cuts and Jobs Act of 2017"), most of that improvement went into increased savings.
- The BEA's deflators were once again boosting the headline number, in this case by +0.53%.
The US economy was probably somewhat cooler than the BEA's already tepid headline number might suggest. Downward trending headline growth rates slightly above 2% is not the stuff that economic dreams are made on.
Disclosure: None.


