
Anticipation Is Everything
It’s difficult to get past the obvious at the moment. Markets have made their bet on further monetary easing, and they’re now waiting for central banks to deliver.
Policymakers have been showering markets with promises to “act if needed,” and assurances from those stuck at the zero bound that the toolbox is far from empty. But they haven’t done anything yet, though this is a position that will be closely examined this week. Mr. Draghi will be at the spotlight first today when he delivers his introductory statement at the ECB forum in Sintra. The nebulous 5y/5y forward inflation gauge has crashed to new lows recently, and it seems to me that the consensus now expects a signal from Mr. Draghi that the ECB will cut its deposit rate, or re-start QE, as soon as September, which incidentally will be Mr. Draghi’s last meeting as ECB president.
Meanwhile at the Fed, the only question seems to be whether The FOMC cuts by 25 or 50 basis points in the next few months, setting the stage for an interesting June meeting this week. To the extent that markets have priced-in monetary easing in response to the deteriorating trade negotiations between the U.S. and China, it would make the most sense to assume that the much anticipated Osaka sit-down between Mr. Trump and Xi—at the end of June—to be a catalyst for something in markets.
I am fairly confident, how-ever, that investors are poised to run away with the narrative this week if messieurs Draghi and Powell provide even the slightest hint that the dam is cracking. Objectively, it would make sense for both the Fed and the ECB to lean against market expectations, but I can’t be sure that they will. The arc of the narrative is bending strongly to-wards the imperative for policymakers to do more, anything really, to ensure that the current expansion continues, whatever the costs in terms of capital misallocation and future inflation.
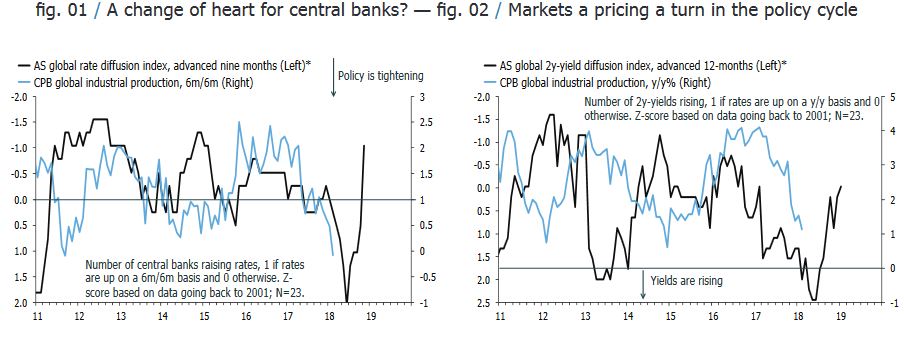
The mounting evidence of a shift in global monetary policy has reminded me of a tool that used to be a key tool in my kit of indicators; a diffusion index of global central bank rates, and bond yields. The idea is simple, when global short-term rates are rising, it tends to lead economic activity down by six-to-nine months, and vice versa when rates are falling. The two charts below try to put this idea to the test. The first shows that a six-month diffusion index of central bank rates points to a positive inflection point for global industrial production growth in the second half of the year, though it is worth noting that this framework doesn’t distinguish between unchanged and outright falling rates. The second chart tries to correct for this by showing a diffusion of global two-year yields. It also suggests that a bottom in global growth will form at some point in H2.This is good news for equity bulls—and potentially bad news for bond bulls—though the leading economic data only partially support this message. The best thing I can say about global real M1, and my in-house diffusion index of leading indices, is that they aren’t falling anymore, at least not as rapidly as at the start of the year. That said, neither of them were showing any convincing signs of rebounding at the start of Q2. Data for the domestic economies in Europe and in the U.S. have generally been solid, but most indicators for trade and manufacturing are still signalling downside risks to headline GDP growth.
In an environment where markets are moving in for the kill on central banks, I’d prefer to own the front end rather than the long end, effectively betting on a bull steepening of the curve. Mr. Powell et al. have power over short-term rates, but they don’t control the long end, as much. If central bankers are about to ease, based on a world view that is too pessimistic, short and long-term rates will move in opposite directions.
The main downside risk to this idea is that policy makers are about to tell markets that they have been wrong all along in pricing-in easing. This is possible, but it is fair to say that the prob-ability of rate hikes is fairly low, at this point, at least through this year.
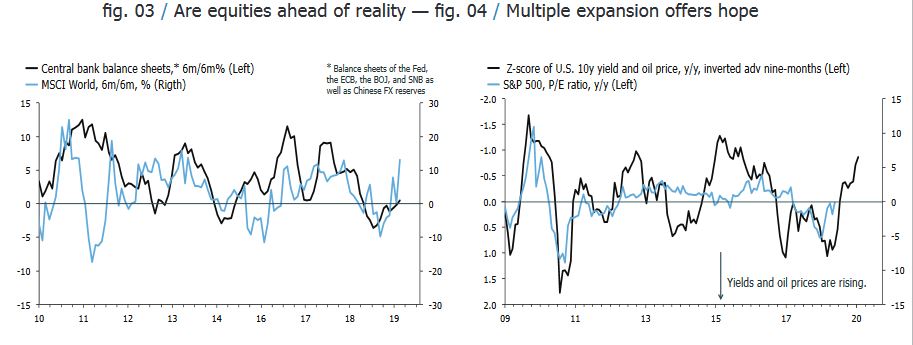
In equities my indicators are all over the place. After a strong run in the first half of the year, after the dreadful Q4, my home-cooked models suggest that markets will struggle in the next six months. This is consistent with the idea that equities tend to do poorly in an environment where central banks are easing policy in response to slowing growth. Add to this the fact that earnings growth has stalled, and betting against equities should be an easy trade in the next six months. The first chart below shows that returns are running well ahead of the actual actions by central bank, at least with respect to their balance sheets.
The second chart presents the counterpoint. It effectively tries to quantify the idea that central banks are being bullied into easing in a world that doesn’t need it. The fall in bond yields and oil prices point to a rising equity multiple in the next nine months. Taken at face value, this index suggests that the S&P 500’s P/E ratio will be up by five points by the end of Q1 next year.
Even with a constant level of nominal earnings—an EPS of some $153—it would be enough to drive the index up to 3600, a punchy 25% upside from last week’s closing price. I struggle with this signal. It’s an old cliché that the best thing about a holiday is the anticipation of it. Could be the same be said about the expectations for major central banks to ease policy in H2?
----
* /See additional charts on final page
** / Data for charts are sourced from FRED, OECD, Eurostat, IMF, BIS, Market Watch, Yahoo/Google Finance, COT, Bloomberg, Investing.com or Quandl, unless otherwise stated.
Disclosure: None


