
All Of The World’s Money And Markets In One Visualization
(Click on image to enlarge)

The era of easy money is now officially over.
For 15 years, policymakers have tried to stimulate the global economy through money creation, zero-interest-rate policies, and more recently, aggressive post-COVID spending.
With capital at near-zero costs over this stretch, investors started to place more value on cash flows in the distant future. Assets inflated and balance sheets expanded, and money inevitably chased more speculative assets like NFTs, crypto, or unproven venture-backed startups.
But the free money party has since ended after persistent inflation prompted the sudden reversal of many of these policies. And as Warren Buffett says, it’s only when the tide goes out do you get to see “who’s been swimming naked.”
Measuring Money and Markets in 2022
Every time we publish this visualization, our common unit of measurement is a two-dimensional box with a value of $100 billion.
Even though you need many of these to convey the assets on the balance sheet of the U.S. Federal Reserve, or the private wealth held by the world’s billionaires, it’s quite amazing to think what actually fits within this tiny building block of measurement:
(Click on image to enlarge)
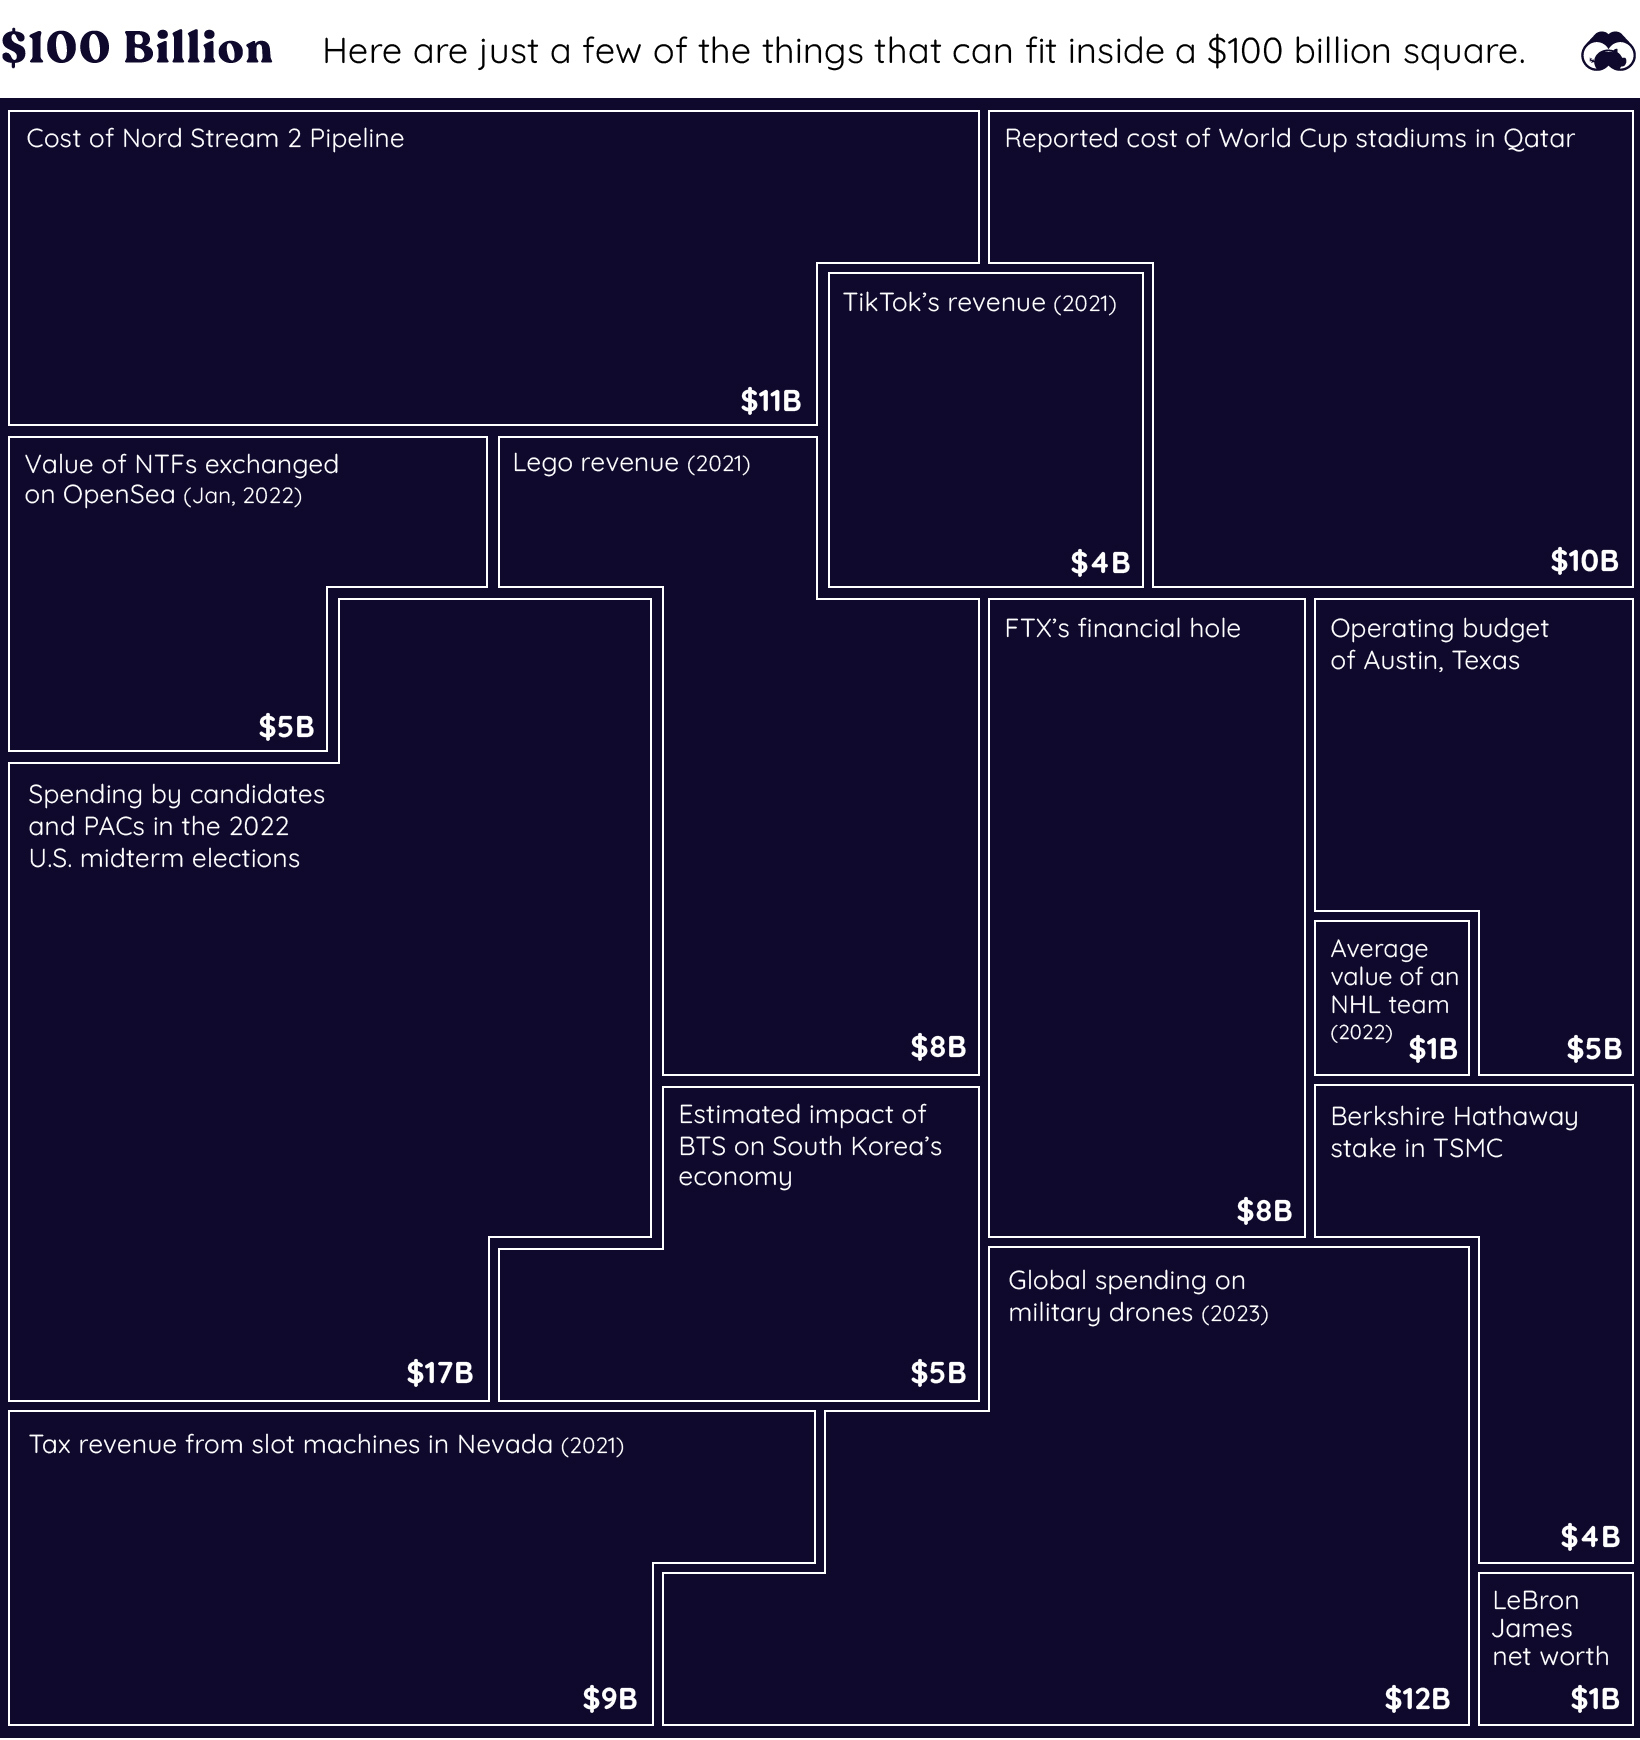
Our little unit of measurement is enough to pay for the construction of the Nord Stream 2 pipeline, while also buying every team in the NHL, and digging FTX out of its financial hole several times over.
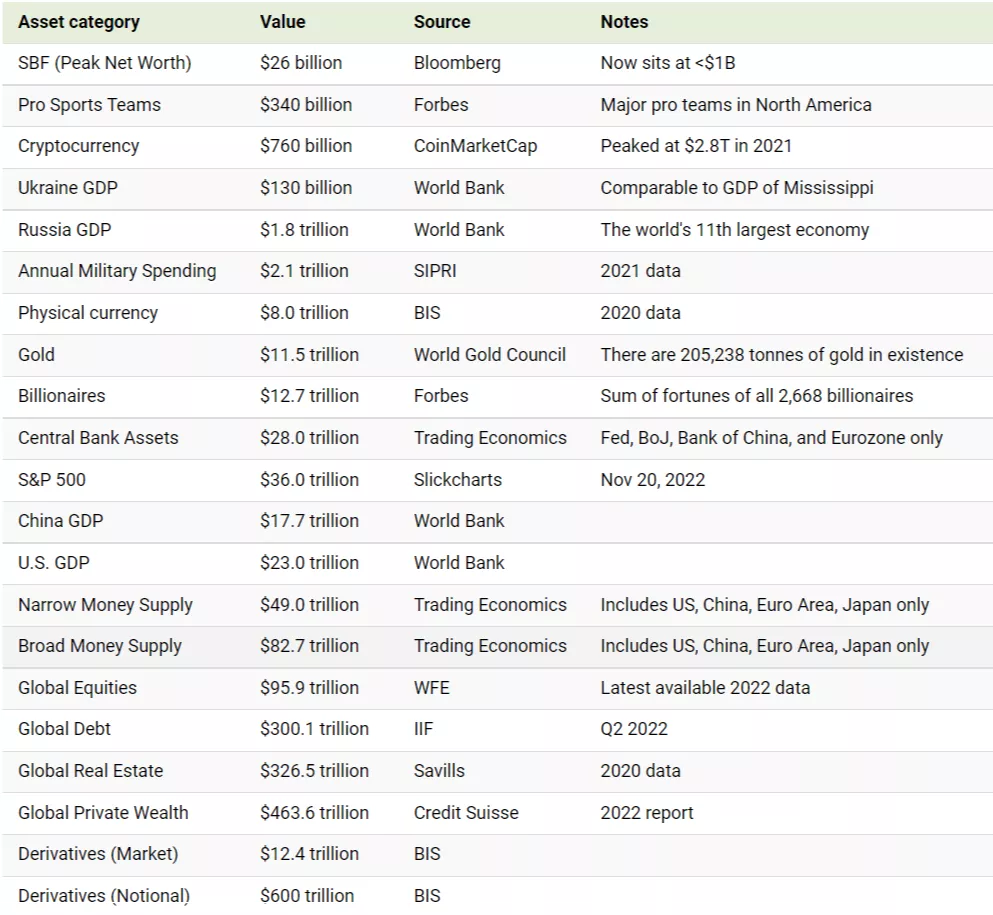
Here’s an overview of all the items we have listed in this year’s visualization:
(Click on image to enlarge)
Has the Dust Settled Yet?
Through previous editions of our All the World’s Money and Markets visualization, we’ve created snapshots of the world’s assets and markets at different points in time.
For example, in our 2017 edition of this visualization, Apple’s market capitalization was only $807 billion, and all crypto assets combined for $173 billion. The global debt total was at $215 trillion.
(Click on image to enlarge)

And in just five years, Apple nearly quadrupled in size (it peaked at $3 trillion in January 2022), and crypto also expanded into a multi-trillion dollar market until it was brought back to Earth through the 2022 crash and subsequent FTX implosion.
Meanwhile, global debt continues to accumulate—growing by $85 trillion in the five-year period.
With interest rates expected to continue to rise, companies making cost cuts, and policymakers reining in spending and borrowing, today is another unique snapshot in time. With the easy money era over, where do things go from here?
More By This Author:
Charted: Income Distributions in 16 Different Countries
3D Mapping The World’s Largest Population Density Centers
Ranked: The World’s Top Cotton Producers
Disclosure: None.


