
A Tsunami Of Take-Ups In The Fed's O/N Reverse Repo Facility Nullifies QE, Tightens Systemic Liquidity
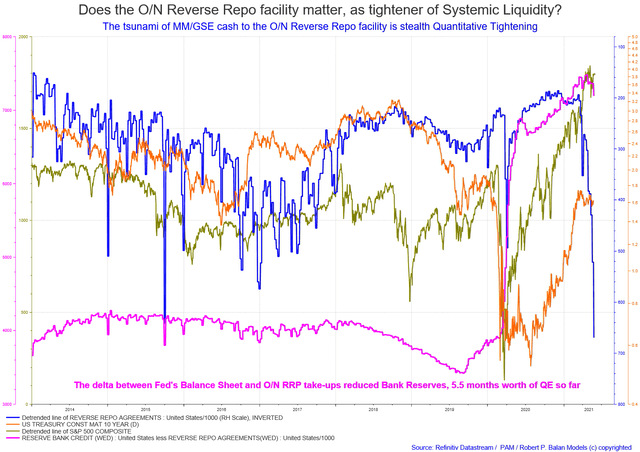
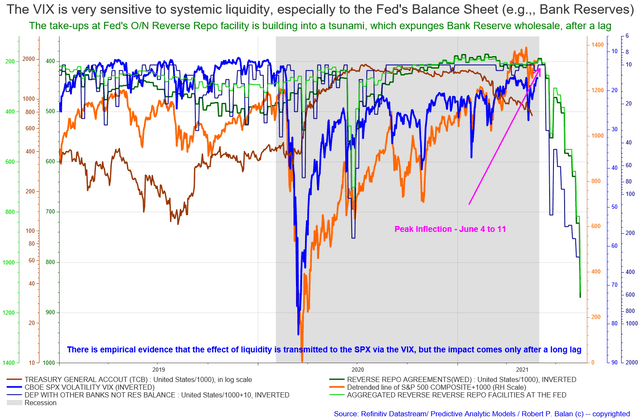
Unless an investor has been staying under a rock in the past several weeks, she/he would have read about the case of a tsunami of cash that was headed, and is still heading, for the Federal Reserves' Overnight (O/N) Reserve Repo facility (O/N RRP) to find a home (see Chart No. 1, below). In a reverse repo transaction, the Fed sells a security to an eligible counterparty with an agreement to repurchase that same security at a specified price at a specific time in the future. It is analogous to putting up money for deposit in a bank, but where the bank gives you back Treasury securities as collateral.
Chart No. 1
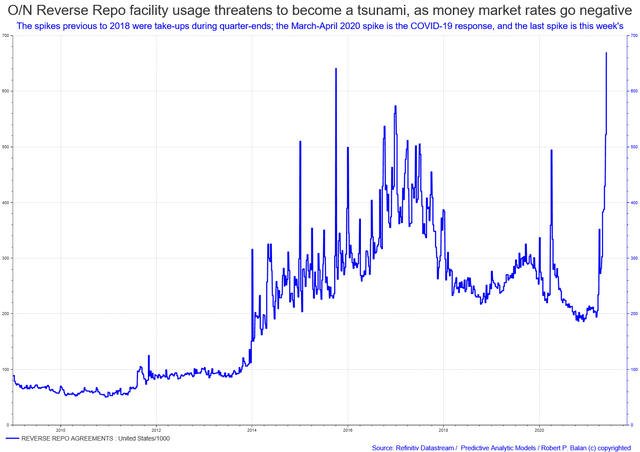
Reverse Repo operations have always taken out liquidity from the financial system and have been used by the Federal Reserve as one means of tightening monetary policy when done in large scale. But the history of O/N RRP's use as a tool to tighten financial conditions has been episodic, so it is not clear if this recent surge in volumes of take-ups in reverse repo matter as tightener of financial liquidity today. So we ask: does the current tsunami of take-ups in the Fed's O/N Reverse Repo facility matter, as tightener of systemic liquidity?
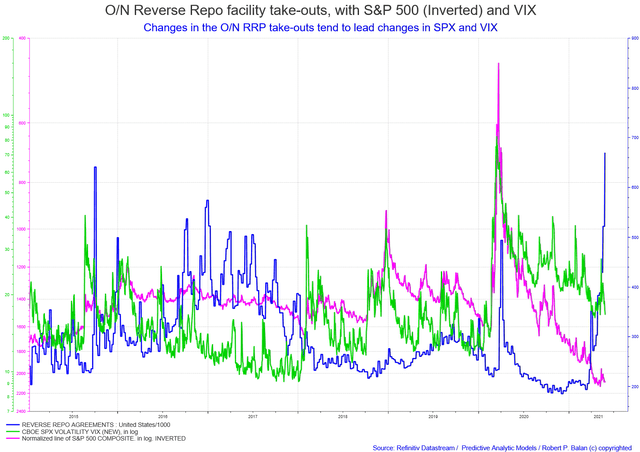
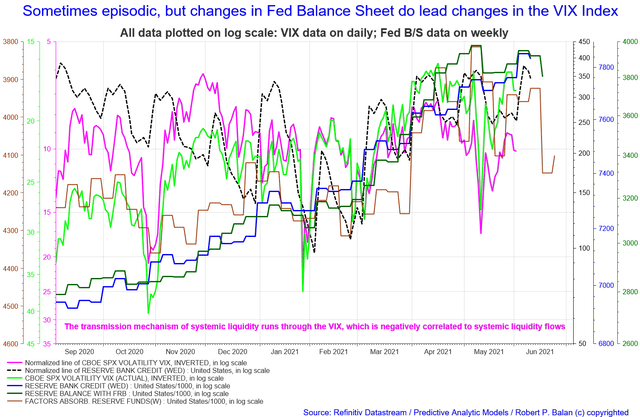
We say, yes, it does matter -- a lot. Changes in the O/N RRP take-ups tend to lead changes in SPX and VIX (see Chart No. 2, below). But the negative effects materialize only after a long time lag, so investors have to be on the lookout for it. We explain in detail in this article why the deluge of cash heading for the O/N RRP in the foreseeable future tightens systemic liquidity and may trigger market "dislocations" no one expects. But we say that wait for another two weeks, or three, and the market will start talking about how the market will react badly to it.
Chart No. 2
The Fed is still buying about $120 billion per month in Treasury securities and mortgage-backed securities, thereby adding systemic liquidity. But with the take-ups in the O/N Reverse Repo facility of $670 billion (to date), the Fed undid almost 6 months of Quantitative Easing. The Fed does stealth Quantitative Tightening (QT) with the O/N RRP. And it looks like this situation will continue for the foreseeable future: ZeroHedge reported today that Money Market Funds (MMFs) see massive inflows as investors turn defensive, and those MM funds have nowhere else to turns to, but the Fed's O/N RRP facility. The O/N RRP pays out zero percent (0%) interest, but that is a lot better than funds paying negative rates in the money markets (investors pay interest on funds placed).
When the Fed conducts QE, that mechanically expands the size of the banking system's aggregate balances sheet (with Bank Reserves), but some of that "money" can also be absorbed by the Treasury General Account (NASDAQ:TGA), the US Treasury's checking account at the Fed. The TGA has expanded to $1.831 trillion by July last year when the Treasury "stockpiled" cash at the TGA in anticipation of COVID-19 relief measures. That did happen, but not to the extent anticipated by the Treasury, so most of the remaining cash has to be drawn down to comply with regulations. There will still be a massive cash outflow from the TGA (see Chart No. 3, below) following the mandates of the US Treasury.
Chart No. 3
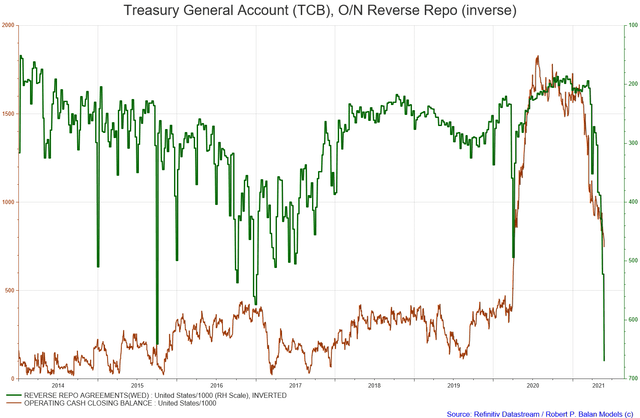
Hundreds of billions in cash will be released from the Treasury's Treasury General Account ("TGA"), see Chart No. 3, above. The TGA has declined to $779 billion so far, so more drawdown is coming. Those funds will go looking for a home to park as well -- and there is no choice now, but to gravitate to the O/N RRP facility. Funds from TGA will be flooding into the O/N RRP until there's only $500 billion left in the account, maximum, by end of June 2021.
How does this massive flood of cash to O/N RRP pose systemic risks?
How does systemic liquidity tightening happen in this case? Here is how the ON/RRP take-outs reduce Bank Reserves. Envision it from the top-level -- how assets and liabilities of the Fed's balance sheet (SOMA) interact (see Chart No, 4, below). O/N RRP is a General Collateral operation, so lenders to the facility are provided by the Federal Reserve Treasury collateral in the take-ups. Money market and GSE (Government-sponsored Entities) funds are placed into the O/N RRP, and the Fed issues those investors Treasury securities as collateral for those placements.
Chart No. 4
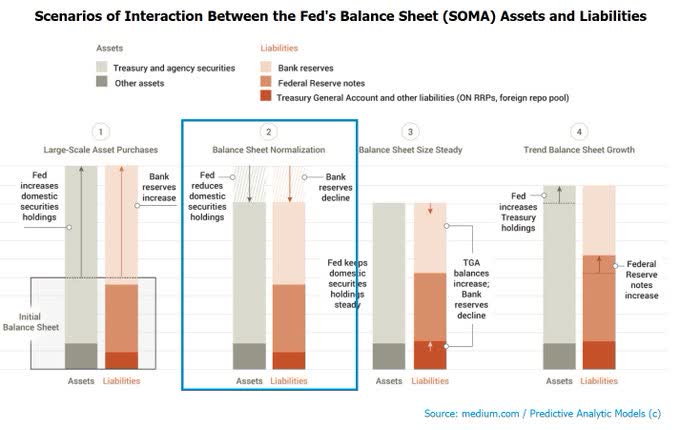
So what happens is illustrated in Scenario 2 of the graphics provided above. The Fed provides the O/N RRP lenders Treasury collateral, and that comes from the SOMA holdings. The Fed reduces its securities holdings, and that lowers/expunges Bank Reserves mechanically. How? When the Fed does QE, it buys Treasury securities from the market, and issues Bank Reserves, one-to-one, meaning $1 billion of security purchase creates $1 billion of Bank Reserves, which is paid the previous owners of those securities. So when the Fed issues Treasury securities to the O/N RRP take-ups as collateral, bank reserves are diminished by the same amount, and the Treasury securities go back into the market.
Scenario 2 is an asset-swap-in reverse (Quantitative Tightening) and should be seen in the light of what QE does to the economy. Quantitative Easing (QE) is more about changing the composition of money -- converting Treasuries into Bank Reserves ("BRs"). QE purchases remove those Treasuries from circulation. A smaller market supply of Treasuries makes the remaining bonds more valuable (higher bond prices; lower bond yields). The lower yield drives down interest rates on the U.S. debt. Lower interest rates mean the government doesn't have to spend as much to pay off its loans. For the Fed, QE may seem to be a "magic bullet" (that's probably why they are doing so much of it).
Chart No. 5
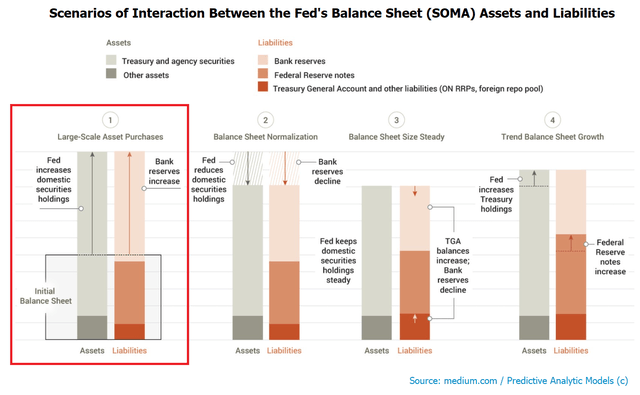
The Fed's technical name for QE is Large-Scale Asset Purchases (LSAPs). The schematic of that program is illustrated in Scenario 1 in Chart No. 5, above. In simplistic terms, that impounds "money" in the Fed (in the form of BRs) instead of the Treasuries remaining at large in the market. The impact of that is to lower short-term interest rates, which pushes investors into riskier assets (the 'portfolio rebalancing' effect).
Thus, QE pushes asset prices higher (and bond yields lower, especially ultra short-term rates). But it is thereby deflationary because there will be less money to spend on goods and services, which is what indexes like CPI measures. Also, interest rates are generally lower after QE, therefore, the base cost of producing stuff is lower. That is why the Fed insists that inflation is transitory because the CPI measures are, according to the central bank, being merely pushed up by supply constraints as a consequence of the COVID-19 epidemic, rather than by "loose" supply of systemic money.
Chart No. 6
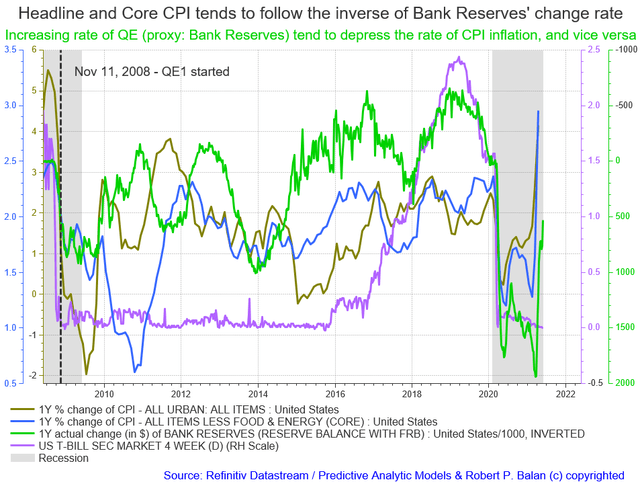
We actually sympathize with the Fed's view: increasing rate of QE (proxy: Bank Reserves) really is deflationary and does tend to depress the rate of CPI inflation (see chart above). It is when the change rate of systemic liquidity BRs is falling, that CPI inflation starts to rise, as was the case since May last year, and is still ongoing today. That is another negative impact of declining BRs that we have to worry about -- sharply higher inflation.
The Fed's QE program is being neutralized, every coming week
So, the take-ups in the O/N Reverse Repo does the opposite of QE -- that is, taking back Treasuries as collateral and putting them back into the system. What happens is the exact opposite of QE. It is asset-swap-in reverse (Quantitative Tightening, as Bank Reserves are mechanically expunged). Smaller amount of bank reserves reduces the potential for banks to buy other papers such as stocks and bonds, which pushes their prices down.
The impact of this reduction may take some time to manifest, that is why the effect of this QT event has lagged for a while. It was the same for QE -- the Fed announced QE1 on Nov 25, 2008; SPX only bottomed on March 6, at 633.88. But at that time, nobody understood the positive portfolio effects QE has on risk asset prices. It may be different this time -- we already have the template of five QE programs behind us (see Chart No. 7, below), so we now understand the positive impact of QE liquidity on risk asset prices. We may soon see the negative effect of QT on risk assets, too.
Chart No. 7
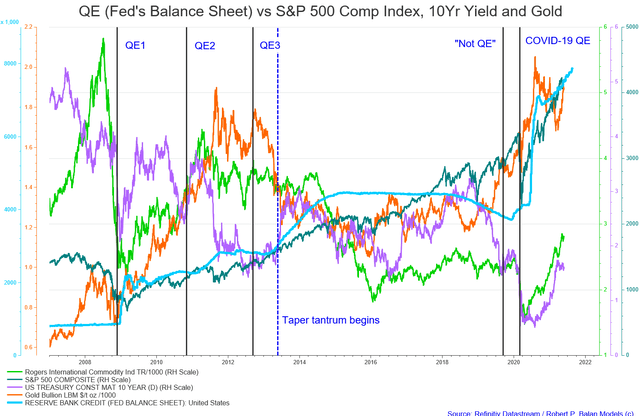
However, I personally do not see this as full QT -- but it will likely have the effect of the "taper tantrum" in May 2013 (see chart above). I also suspect that it will be short-lived. The Fed will act like one of Pavlov's conditioned dogs and will hasten the creation of a Permanent Standing Repo facility, an idea they have been kicking around for the past ten years. I have no idea how they will hasten the process though -- because it is not easy to implement. The Fed has to overhaul the framework of Fed monetary policy plumbing from the "floor" system to a "corridor" system. But I could be wrong. The floor system is uniquely the Fed's. Most other CBs, e.g. BoJ, ECB, follow the corridor system.
Another complication: the Fed works through primary dealers, who intermediate by borrowing from the Fed and then lending to other repo market participants. But there is increasing concern that this transmission mechanism is not working well. Basel III based-regulations have handicapped US Primary Dealers, and in fact, this O/N RRP brouhaha started after the Supplementary Leverage Ratio (SLR) waiver ended in March (see Chart No. 8, below)
Chart No. 8
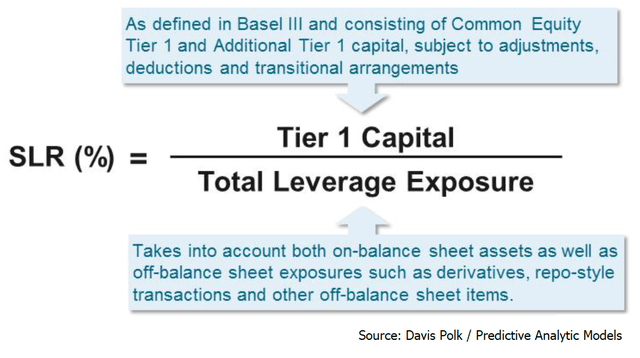
That forced US Global Systemically Important Banks (G-SIBs) to turn away money market funds, which are now besieging the O/N RRP, as the money market alternatives are dismal. The US banking system is chock-full of cash - the Basel III constraints are becoming binding and get in the way. The incremental QE deposits are flowing out of banks and into MMFs, and then down the ON RRP drain. Nonetheless, if the Fed bypasses the Primary Dealer system, and lends directly to non-Primary Dealers and investment funds, that would require a lot of work to re-arrange the repo market's plumbing, and require some time before it gets implemented. I don't think a new Permanent Standing Repo facility is shovel-ready if/when they announce it.
We will discuss this in another article some other time when it is appropriate.
What to expect from here
The delta between Fed's Balance Sheet and O/N RRP take-ups (pink line in Chart No. 9, below) has reduced Bank Reserves, 5.5 months' worth of QE so far (see also Chart No. 1). The tsunami of MMF and GSE cash to the O/N Reverse Repo facility is truly forcing stealth Quantitative Tightening.
Chart No. 9
Why is reduction Bank Reserves significant?
We have already seen the general, if lagged, positive effect of the Fed's Balance Sheet (proxy: Bank Reserves) on risk asset prices in chart No. 7. The next two charts, Charts No. 10 and 11, illustrate just how closely the price of risk assets are now highly dependent on the continuing positive inflows of Bank Reserves into the financial system.
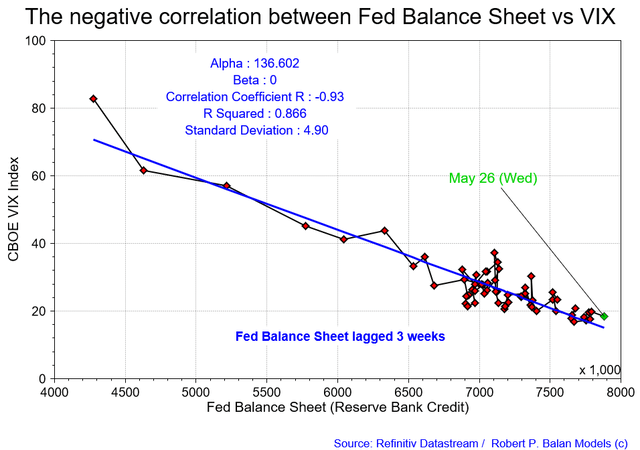
We have empirical evidence that the transmission mechanism of Bank Reserves' positive effect on risk assets goes via the S&P 500 Volatility Index ("VIX"). The VIX is a measure of the SPX's volatility and rises when S&P Index prices fall, and vice versa. Chart No. 10, below, quantifies that inverse relationship via OLS regression analysis: changes in the Fed balance sheet Granger-causes VIX changes (0.93, correlation coefficient), and explains 86.6% of (R^2, coefficient of determination), from March 16, 2020, to-date (below).
Put one way: changes in the Fed's Balance Sheet "explains" 86.6% of the changes in the VIX index.
Chart No. 10
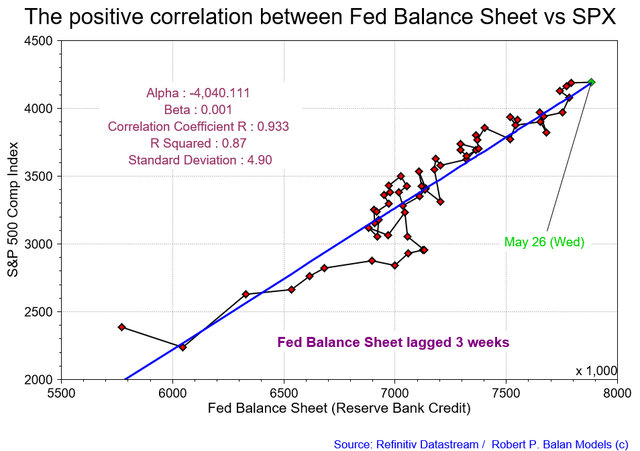
It's more straightforward in the OLS regression analysis of the impact the Fed's Balance Sheet has on the price of the S&P 500 Index (see Chart No. 11, below). Changes in the Fed balance sheet Granger- causes SPX changes (0.933, correlation coefficient), and explains 87.0 % of (R^2, coefficient of determination), from March 16, 2020, to date (chart below). Put another way: changes in the Fed's Balance Sheet "explains" 87% of the changes in the S&P 500 Composite index.
Chart No. 11
Conclusion: what is the likely outcome of this tsunami of cash heading for the O/N RRP?
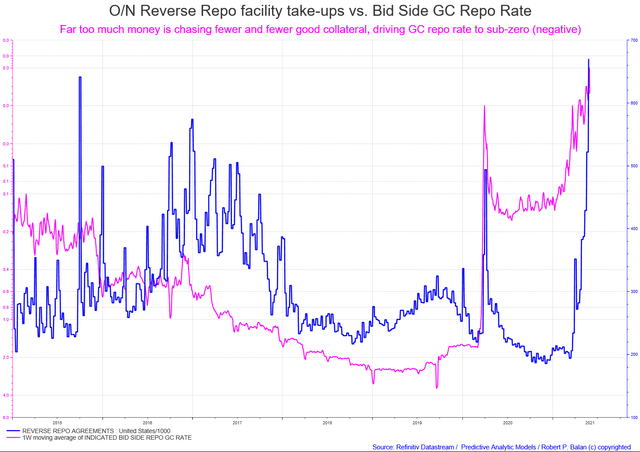
The phenomenon of MMFs pouring into the O/N RRP facility will not be a flash in the pan. There's far too much money chasing fewer and fewer good Treasury collateral, driving GC repo rate to sub-zero (negative), see Chart No. 12, below. Therefore, MMFs that cannot find any investments yielding above the ON RRP offering rate of zero rates have no choice but to park their money in the ON RRP facility, which offer zero rate interest.
Chart No. 12
As I said earlier, there are no alternatives (for now), and so O/N RRP take-ups will grow exponentially. MMF assets currently are circa $1.150 trillion -- there is still a backlog of cash that will be heading for the O/N RRP, looking for a non-negative rate home. This is further exacerbated by the fact that QE will continue into the foreseeable future, and that means $120 billion worth of monthly QE adding to the tsunami of cash heading for the O/N RRP.
The disconcerting part is that all that cash parked at the O/N RRP will likely stay there, effectively impounded. That is Quantitative Tightening on a massive scale. It's true that the O/N RRP take-ups are still dwarfed by the massive Fed Balance Sheet, in nominal amounts. However, we have shown in previous articles that what matters for risk asset prices is the change rate of systemic liquidity (the "flows" -- change over time), not the change in nominal amounts. So, if all that liquidity cash is "impounded," that is liquidity "outflow," pure and simple. The markets never like that, and we show the market response (via the VIX) to episodes of liquidity flows (see chart No. 13, below).
Chart No. 13
There are time lags before risk assets feel the impact of liquidity flows, coming and going. Chart No. 13, below, shows how that could happen with the O/N RRP, in this case after almost a quarter lag. Not many investors consider the tsunami of cash heading for O/N RRP a "gray or a black swan" event, but liquidity tightening is always dangerous. This O/N RRP phenomenon has been going for circa three months, so it may be the case that the long lag of the negative impact may catch up to risk asset prices soon. We are not making specific negative market calls at this time, but we will soon pare down our massive, long equity positioning since the May 19 market trough, which we reloaded several times.
Chart No. 14
We are especially wary of the June 4-11 period, and that extends to the week after that. The period includes the FOMC meeting, the modified Income Tax payment deadline, an eagerly awaited May CPI report, and Options Expiry date. There is a lot of possibilities that can trip up the market during the next few weeks ahead.
This article was a compilation of several articles we published at the PAM blog, namely:
The Correlations Between The Fed's Balance Sheet And S&P 500 Comp Index And VIX Becomes Even Tighter
Disclosure: I am/we are long SPY, IWM, DIA, QQQ. I wrote this article myself, and it expresses my own opinions. I am not receiving compensation for it. I have no business relationship with ...
more

