
A Graphical Framework For Thinking About Anticipated Inflation
From my EconoFact article “Rising Inflation?“, which begins:
There are concerns about inflation rising, and perhaps even accelerating, fueled by an overheating economy as a consequence of the large fiscal stimulus, the Federal Reserve’s commitment to keeping interest rates low for an extended period, and pent-up demand for consumption that was foregone during the pandemic. The last bout of high and rising inflation, in the 1970s, was during a time of economic distress and only ended with a painful recession engineered by the Federal Reserve in the early 1980s. Are we in for a similar episode today? While inflation has been high in the past few months, at least compared to its level since the Great Recession that began in 2008, several factors suggest that we should not be concerned about sustained and accelerating inflation – at least not yet.
This graph is how I organized my thoughts for the memo.
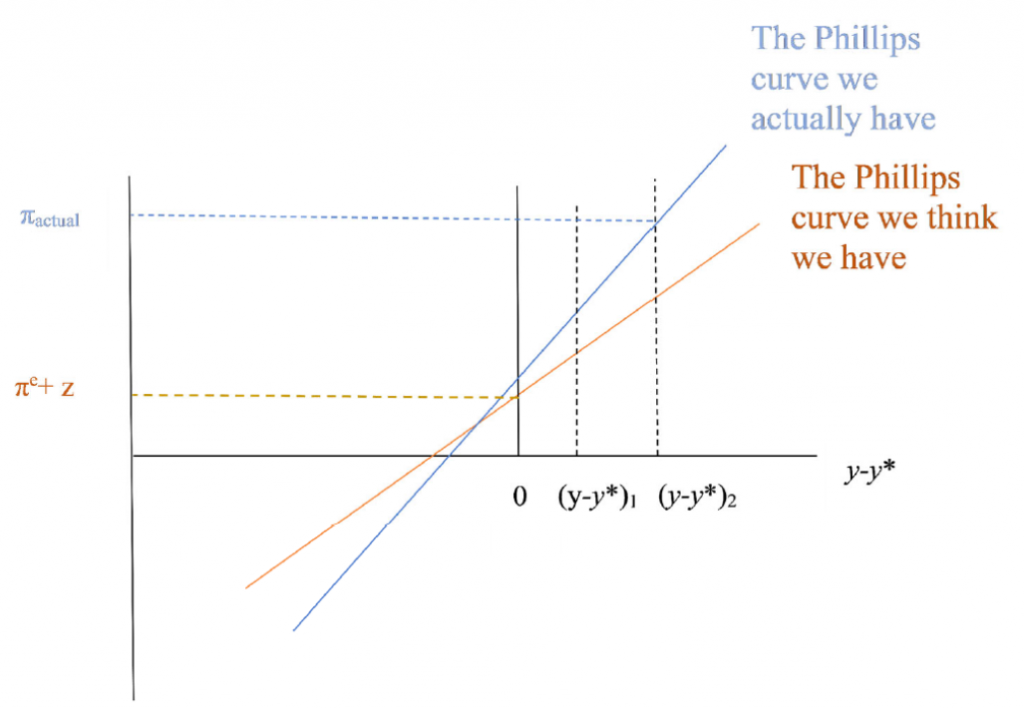
Figure 0: Phillips curves, showing how anticipated and actual inflation rates could differ depending on output gap size, slope of Phillips curve, vertical intercept.
The inflation that results in a year (which I proxy by the survey-based inflation expectation for one year ahead) is based on the Phillips curve:
![]()
Where π is year-on-year inflation, πe is long term expected inflation, (y-y*) is the output gap, f is the slope of the Phillips curve, z is the cost-push component, a function of the growth rate of input prices.
Differences in the anticipated inflation rate can be attributed to differences in each part:
![]()
Hence, faster actual inflation over the next year could be because: (1) long term expected inflation (πe) could be higher, (2) the slope of the Phillips curve (f) is steeper than thought,(3) The output gap (y-y*) is expected to be bigger than previously anticipated, or (4) cost-push shocks, z (oil, input prices rising) are larger.
Actual inflation, one year ahead inflation expectations, and long-term (5-year) inflation expectations shown below (Figure 1, Figure 2 respectively).
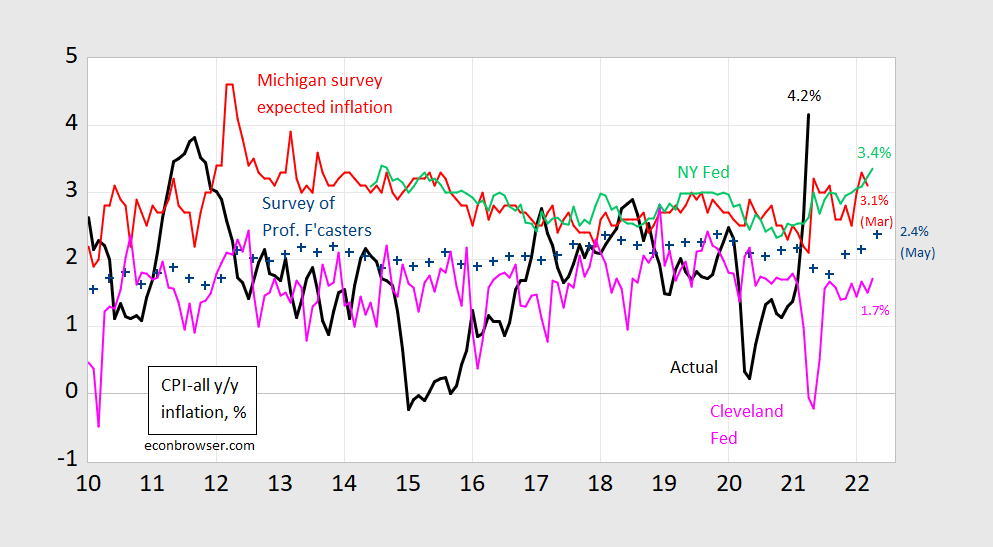
Figure 1: CPI inflation year-on-year (black), median expected from Survey of Professional Forecasters (blue +), median expected from Michigan Survey of Consumers (red), median from NY Fed Survey of Consumer Expectations (light green), forecast from Cleveland Fed (pink). Source: BLS, University of Michigan via FRED, Philadelphia Fed Survey of Professional Forecasters, Philadelphia Fed, NY Fed, and Cleveland Fed.
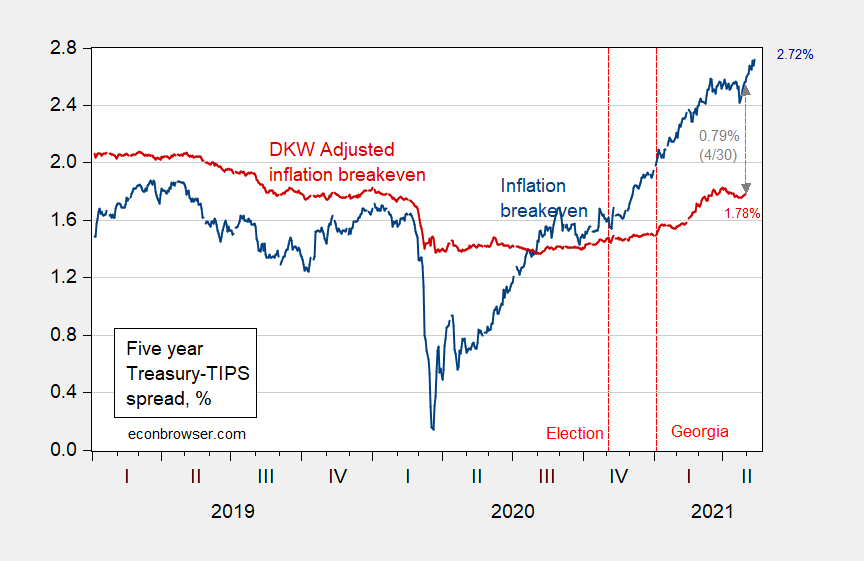
Figure 2: Five year inflation breakeven calculated as five year Treasury yield minus five year TIPS yield (blue), five year breakeven adjusted by term premium and liquidity premium per DKW, all in %. Source: FRB via FRED, KWW following D’amico, Kim and Wei (DKW) accessed 5/5, and author’s calculations.
And here is the forecasted output relative to the estimated potential (Figure 3).
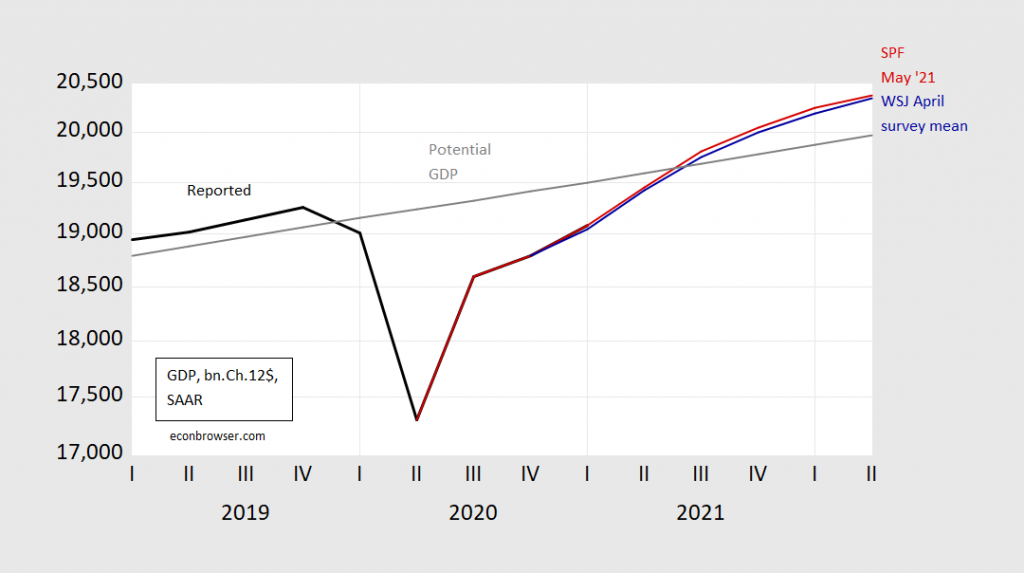
Figure 3: Reported GDP (black), implied GDP from WSJ April survey mean (blue), implied GDP from Survey of Professional Forecasters May survey (red), and potential GDP (gray). Source: BEA 2021Q1 advance release, WSJ April survey, Philadelphia Fed Survey of Professional Forecasters May survey, CBO Economic Outlook (February 2021), and author’s calculations.
I ended the EconoFact article thus:
Inflation — both actual and expected — matters. Inflation makes it harder for consumers and workers and firms to distinguish between relative and general price changes. It also makes it more difficult to make plans for saving and investment. And, higher expected inflation raises borrowing costs for the government (although higher actual inflation erodes the real value of government debt). Finally, the Fed tends to respond to higher inflation by tightening monetary policy, which depresses economic activity. Hence, the stakes are high for avoiding a sustained acceleration in inflation. So far, the actual growth in the price level has been temporary. Expectations of inflation remain muted because either the anticipated output gap or the responsiveness of inflation to the output gap are thought to be small, inflation expectations remain well-anchored, or all three.
Disclosure: None.


