
Hard Economic Data Suggests A Continued Strengthening Of The Economy
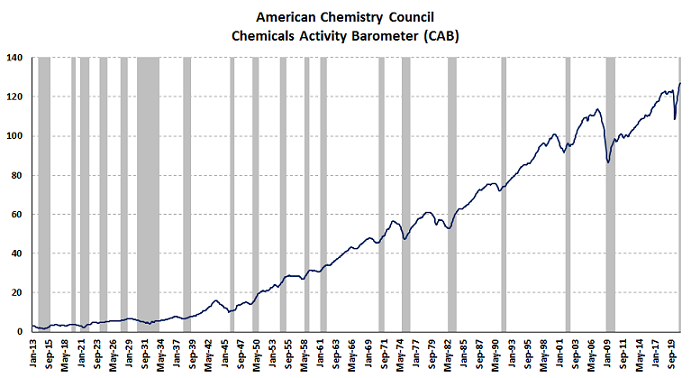
Tuesday's release of the Chemical Activity Barometer (CAB) by the American Chemistry Council clearly is representative of an economy that is strengthening. The report for April showed a twelfth straight month over month increase in the CAB index. The significance of this is the fact the CAB Index leads the trough in the economy by an average of four months. The year over year increase equaled 21.7% and was the largest YOY increase since the 22.6% YOY increase in March 1951. The diffusion index for the CAB data was 100%. This means all the contributors to the index were positive.
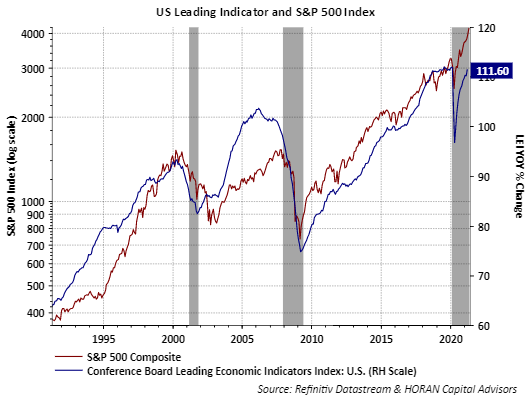
Another important index is the Conference Board's Leading Economic Index (LEI). The latest report for March noted a 1.3% increase. The report noted, “The U.S. LEI rose sharply in March, which more than offset February’s slightly negative revised figure,” said Ataman Ozyildirim, Senior Director of Economic Research at The Conference Board. “The improvement in the U.S. LEI, with all ten components contributing positively, suggests economic momentum is increasing in the near term [emphasis added]. The widespread gains among the leading indicators are supported by an accelerating vaccination campaign, gradual lifting of mobility restrictions, as well as current and expected fiscal stimulus. The recent trend in the U.S. LEI is consistent with the economy picking up in the coming months, and The Conference Board now projects year-over-year growth could reach 6.0 percent in 2021.”
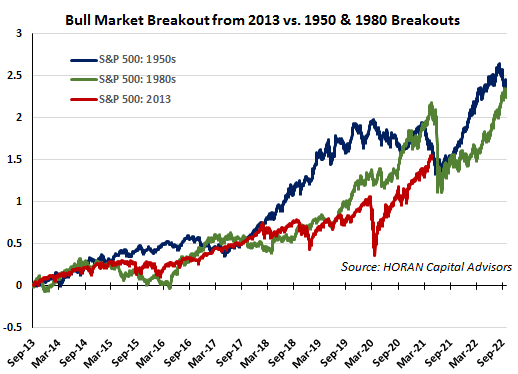
At the beginning of this article I noted the CAB's YOY increase was the largest since 1951. As far back as 2016 I wrote posts noting the current market's trajectory being similar to that of 1950's and 1980's equity market. With some of the recent economic data looking similar to data from the 1950 time period, maybe this market has more room to advance to the upside, but certainly not without setbacks.
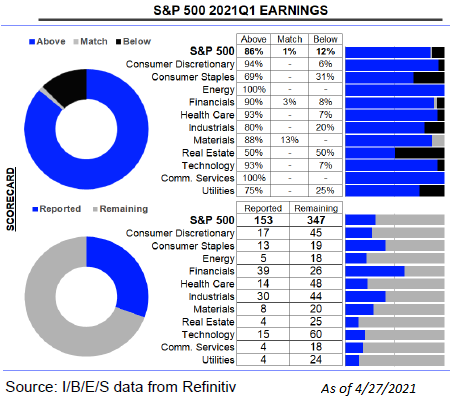
Lastly, peak earnings reporting season for the first quarter is upon us. Of the 153 S&P 500 companies that have reported earnings for Q1 2021, 86% have exceeded analyst expectations. In a typical quarter 65% of companies beat expectations. Maybe more significant is the fact the upside earnings surprise factor is 22.3%. The average surprise factor going back to 1994 is only 3.7%. With more state economies opening and vaccination rates increasing, business activity is picking up and this is reflected in recent strong corporate earnings reports.
Disclaimer: The information and content should not be construed as a recommendation to invest or trade in any type of security. Neither the information nor any opinion expressed constitutes a ...
more

