
Did July’s Headline Jobs Number Miss Business Closures, And So Overcount Job Gains?
A few issues arose with regard to last Friday’s jobs number; in particular, the effect of government jobs in the form of Census and teaching jobs, whether seasonal adjustments are unhelpful at this time; and whether the birth/death model used by the BLS has undercounted job losses (due to increased non-reporting by closed businesses). I’m going to examine this in two posts. Tomorrow (hopefully!) I’ll go into detail as to what withholding taxes can tell us about the employment numbers. Today I want to compare the BLS payrolls data with the Census’s household survey.
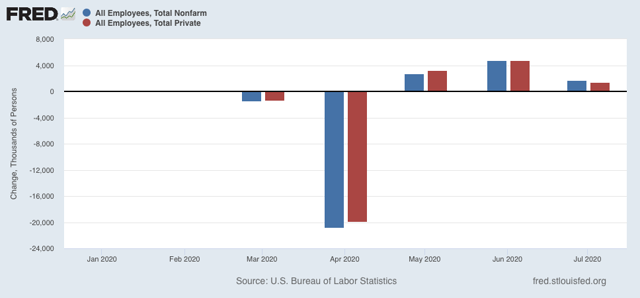
Let’s start with the issue of government employment. Since there were lots of layoffs in schools earlier, the lack of new layoffs in July meant that “seasonally” over 200,000 gains of the 1.763 million jobs reported in July were included in the nonfarm payrolls number (Blue in the graph below). When they are taken out, however, you still get a gain of 1.462 million (red):
(Click on image to enlarge)
A second issue is whether the BLS has been undercounting job losses due to closed businesses. Let’s look at this together with the issue that the pandemic has rendered the seasonal adjustments counterproductive. Because the way to deal with both is to compare the Census Bureau’s household employment report and compare both on a non-seasonally adjusted basis. So, all of the graphs below are *not* seasonally adjusted.
First, here are nonfarm payrolls (blue) compared with household employment (red) for the past 5 years:
(Click on image to enlarge)
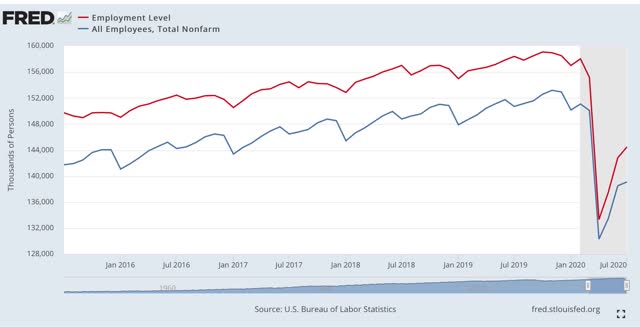
There is always a big decline in January and a secondary one in July. Needless to say, they have both been dwarfed by the effect of the pandemic. But also, notice that both measures have bounced back since April, in roughly equivalent amounts, and both showed gains in July (again, remember these graphs are not seasonally adjusted, so the lack of school layoffs last month is moot).
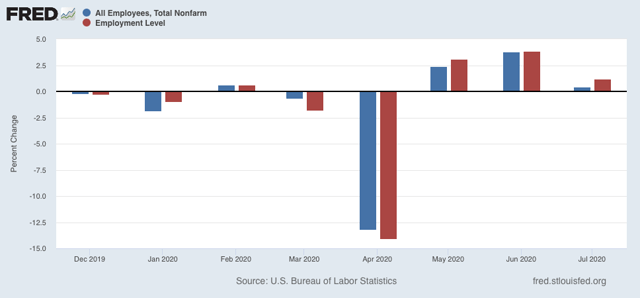
Here is a close-up of the last few months. Again we see that the improvements in both the BLS employer survey and the Census Bureau’s household survey have been comparable:
(Click on image to enlarge)
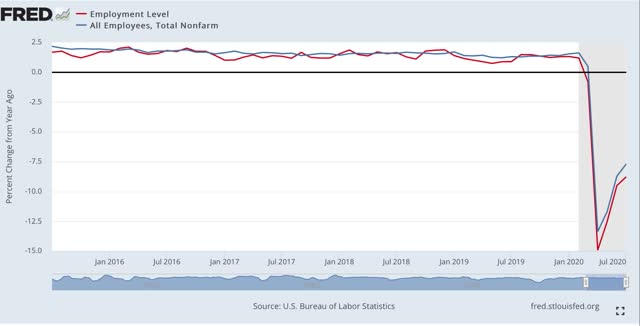
The same shows up in the YoY% measures of both the BLS and Census Bureau data:
(Click on image to enlarge)
Finally, let’s compare the monthly % change for both measures over the past 5 years through this past January:
(Click on image to enlarge)
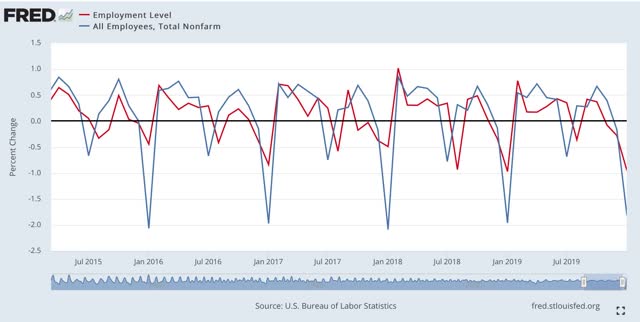
Again, note the large January and smaller July declines. In the case of July, it’s not unusual for there to be a one month delay in the Census (red) vs. the BLS (blue) decline. It’s also not unusual at all for there to be a month to month deceleration in job gains in the Census figure.
Now let’s show just this past year:
(Click on image to enlarge)
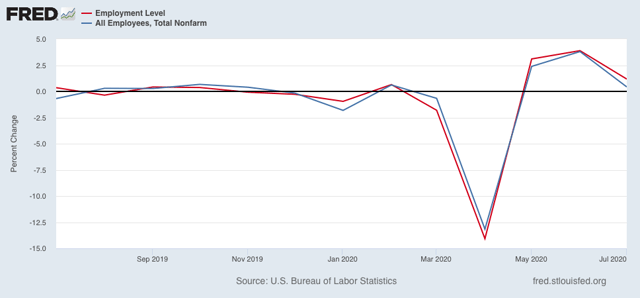
Notice that the scale of the % losses and gains is much larger. But the Census and BLS monthly changes are in line with one another.
In sum, comparing the Census Bureau’s household report data with the BLS’s employer survey strongly suggests that the official BLS jobs number has not been missing a significant number of job losses due to a spike in business closures.


