
Did China’s GDP Growth 3.2% Or 60%?
China reported a 3.2% GDP growth in Q2. That number sounds about right to me. But I can’t help noticing that if China reported its GDP growth rates the way the US government does, it would have reported roughly 60% growth in Q2. At least I think it would have; see if you can follow my argument and correct any errors:
China’s GDP data shows year-over-year growth. Thus Q2 GDP in China was 3.2% above 2019:Q2. But how much did it grow relative to last quarter?
(Click on image to enlarge)
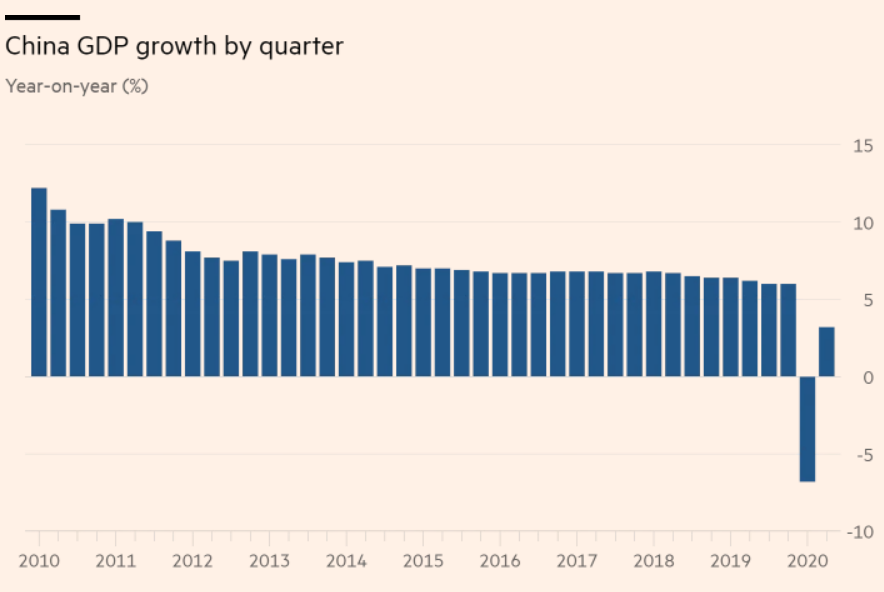
In Q1, China’s GDP fell by 6.8% relative to 2019:Q1. But how much did it fall by compared to the previous quarter? My guess is that it probably fell by at least 11% from 2019:Q4, as prior to Covid-19, China’s GDP had been rising at a fairly steady rate of roughly 6%/year. If China’s GDP in 2019:Q4 was 4% or 4.5% above 2019:Q1 GDP, then the plunge from the peak in 2019:Q4 to the trough in 2020:Q1 would have been roughly 11%. Does that make sense?
Now consider 2020:Q2 GDP, which was 3.2% above 2019:Q2. Given the 6% annual trend growth, it seems likely that by 2019:Q4, China’s GDP was roughly 3% above 2019:Q2 levels. Thus China is basically claiming that the 2020:Q2 GDP has roughly returned to the levels of the end of last year.
To summarize, China’s GDP fell by roughly 11% in Q1 and returned to roughly the 2019:Q4 levels in the second quarter. That means the growth in the second quarter was a bit over 12% (the growth rate of going up from 89 to 100.)
So where do I get the 60% figure in the post title. It turns out that the US does not report quarter-over-quarter growth rates for GDP; we report quarter-over-quarter growth rates that have been annualized. Growing from 89 to 100 is a bit over 12%, but if you annualize that rate (including compounding) the rate is close to 60%.
The weird thing here is that usually when growth rates between countries are non-comparable it’s because one is a 3-month rate (as in Europe) and one is a 12-month rate. But both the US and China report 12-month growth rates. It’s just that China reports the growth rate over 12 actual months, whereas we look at growth over 3 months and then annualize it. In this case, the two techniques produced stunningly different results.
Soon the US will report Q2 GDP data, which will likely look awful. This post suggests that it won’t be quite as awful as the headline figures suggest (although it obviously won’t be good.)
PS. The best way to report GDP growth is to provide the growth rates according to both the US and Chinese technique. These two figures are more informative about the current state of the economy than either rate in isolation. They each tell use something useful that the other figure does not. So don’t fall into the common mistake of trying to figure out which approach is best. You need both!


