
Defining Trends With Naked Charts And Making Trade Analysis Simple
Have you ever encountered a situation where the price moves in one direction?
Do you think you are making some cool pips? The price is moving in one direction because it is following a trend.

In this guide, we are going to hone in on what a trend is, how it works and how you can take advantage of it.
What is a trend?
A trend is a tendency of prices to move in one direction over time. Trends can be upward, downward, or even sideways.
Higher highs and higher lows are usually noted in an uptrend, while in a downtrend, lower highs and lower lows are usually marked.
A sideways trend occurs when the price moves in a narrow band, neither upward nor downward.
Let’s start defining trends – we’ll define each type of trend in detail.
Uptrend
An uptrend depicts a financial asset’s price movement when the overall tendency is higher. Each consecutive peak (highs) and trough (lows) in an uptrend is higher than those observed earlier in the trend.
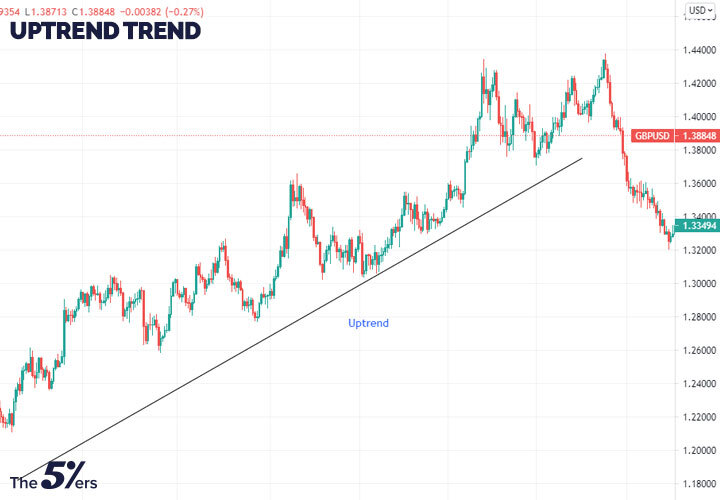
As a result, the upswing is made up of higher swing lows and higher swing highs. Therefore, the uptrend is regarded intact as long as the price makes these higher swing lows and higher swing highs.
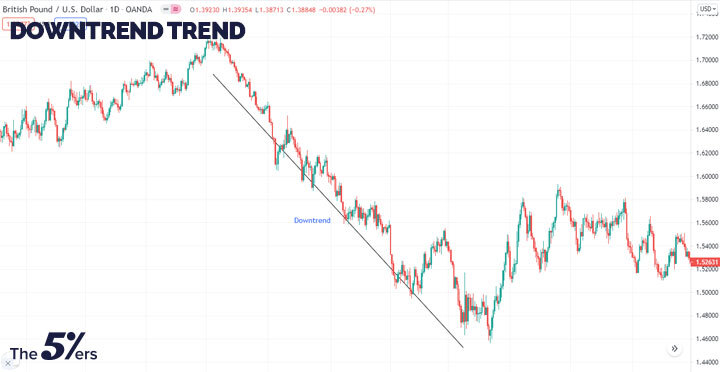
Downtrend
A downtrend is the price movement of an asset that decreases in price as it fluctuates over time. While the price may fluctuate up and down, downtrends are distinguished by lower peaks and lower troughs over time.
Sideways trends
Sideways trends are typically caused by prices moving between strong levels of support and resistance. It is not uncommon for a horizontal trend to dominate the price action of a certain asset for an extended period before a new trend higher or lower begins.
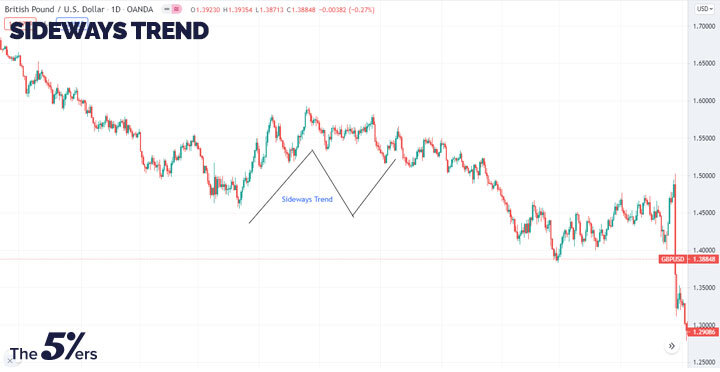
Consolidation phases are sometimes required during long-term trends since such significant price changes are practically impossible to sustain over the long run.
How to identify trends?
There are many ways to identify trends like price action, trendlines, technical indicators, and fundamental analysis.
Price action
The basic price action of an asset is the simplest method to identify trends.
An uptrend can be identified when the asset’s price consistently makes higher highs and higher lows, whereas a downtrend happens when the price regularly makes lower lows and lower highs.
Trendlines
Trendlines, which connect a succession of highs or lows, is a typical approach to identify trends.
Uptrends connect a sequence of higher lows, forming a level of support for future price moves. Conversely, downtrends link a sequence of lower highs, forming a level of resistance for future price moves.
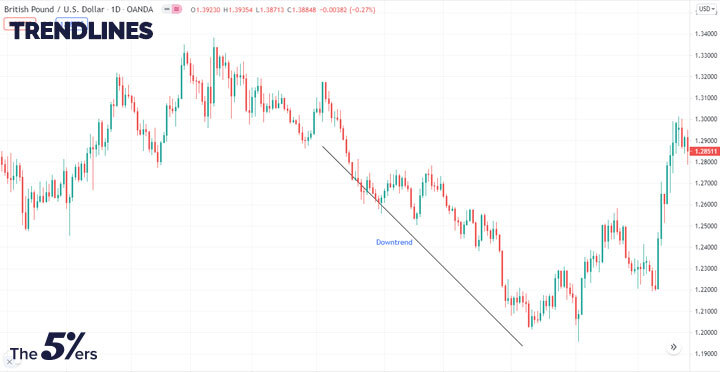
These trendlines, in addition to showing support and resistance, illustrate the overall trend direction.
While trendlines are useful for indicating broad direction, they must frequently be redrawn.
For example, during an upswing, the price may fall below the trendline, but this does not necessarily indicate that the trend has ended.
The price may fall below the trendline before recovering again. In this case, the trendline may need to be redrawn to account for the current price action.
Technical indicators
Technical analysis indicators are a crucial aspect of discovering, defining trends, and confirming market trends. In addition, these indicators are used to examine past trends and forecast future movements.
Some of the commonly used indicators for finding trends are:
A. Moving Average
The moving average determines the current price trend’s direction. The MA averages the price of a specific asset over a given period and then divides the price value by a number of data points. This results in a single trend line.
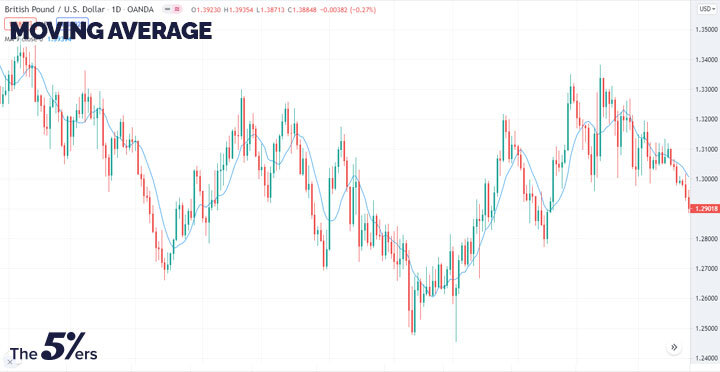
Traders can use moving averages to identify significant support and resistance levels. The MA is divided into two types: SMA (simple moving average) and EMA (exponential moving average) (exponential moving average).
B. MACD
By comparing two moving averages, the MACD (Moving Average Convergence Divergence) detects price variations.
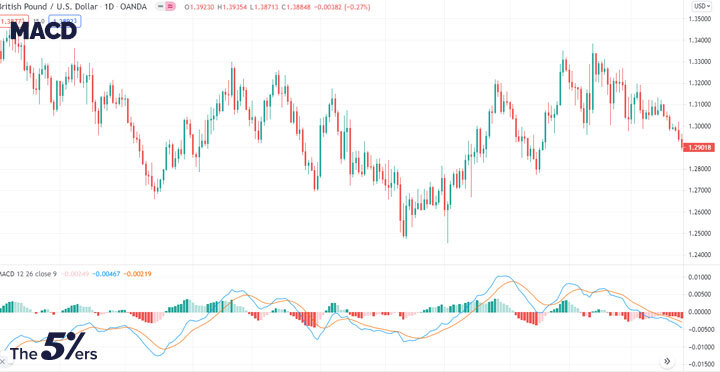
Convergence is defined as a decrease in the distance between two moving averages. Divergence is defined as the separation of two moving averages. Moving averages that are converging indicate downward momentum, whereas moving averages that are separating indicates upward momentum.
C. RSI
The relative strength index (RSI) is an oscillator that identifies major price trends.
The RSI scale is from 0 to 100. An overbought circumstance exists when the asset’s price is greater than or equal to 70. If on the other side, the RSI falls below 30, this indicates that the market is oversold.
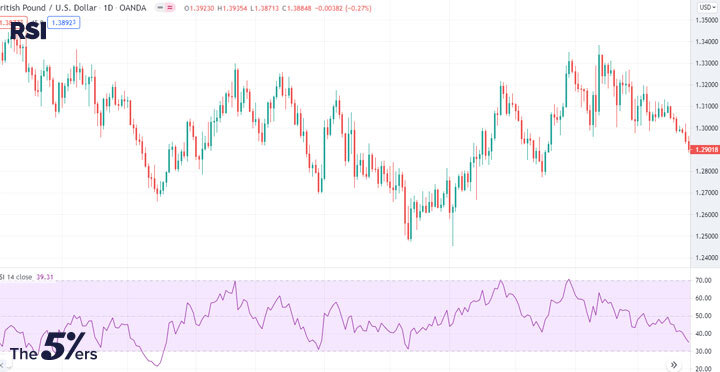
An overbought condition indicates high buying pressure and that the price may decline in the future. On the other hand, an oversold level indicates that there is substantial selling pressure, and the price may climb in the future.
D. Fundamental analysis
You can also use it to identify trends through fundamental analysis. This form of analysis looks at changes in economic or political metrics.
For example, if the political and economic situation of the country is stable, its currency will have a positive trend. On the other hand, if the country is in economic or political turmoil, its currency will have a negative trend.
Trend Trading strategy Moving Average Crossover
One of the popular trend trading strategies is Moving Average Crossover.
A trader would focus on whether the price is above or below the MA while looking at a single moving average. If the price is higher than the moving average, it indicates an uptrend; if the price is lower than the moving average, it indicates a downtrend.
However, a typical moving average method is to search for crosses between two moving averages, as this can indicate a change in price direction.
Normally, two exponential moving averages (EMA) would be used: one fast EMA and one slow EMA.
The chart below shows the shorter 9-period EMA in blue, while the longer EMA of 20-period in black.
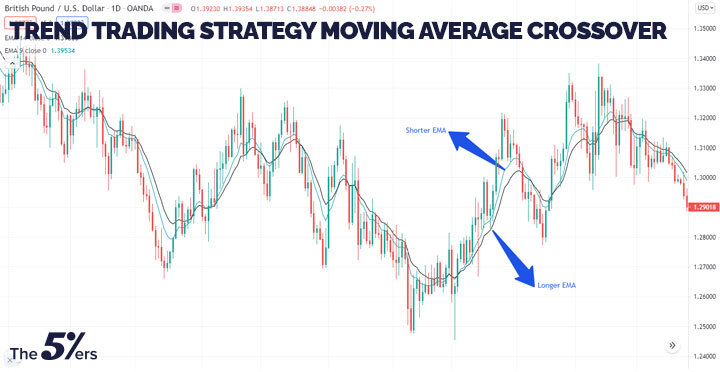
When the fast EMA crosses the slow EMA from below, you enter a long position, and when the fast EMA crosses the slow EMA from above, you enter a short position.
Defining Trends with Naked Charts – Bottom line
Remember that a trend is your friend till it lasts. So you need to combine technical and fundamental analysis when going long or short.


