
December 2018 Market Update
The theme for 2018 is volatility. After an uninterrupted rise in 2017, 2018 is making up for the lack of volatility. The S&P 500 has now experienced two corrections of 10%+ and many are questioning whether the bull market is over. But is this justified?
The data continues to show an expanding economy, solid corporate profits, and reasonable valuations compared to fixed income. 2017 may have gotten too optimistic (and complacent), but now the market is getting too pessimistic about future growth. There is little chance of a recession in the next year.
The recent declines can be attributed to a variety of headwinds. Trade with China, the potential for a messy Brexit, Italy, France, political gridlock, take your pick. This weighs on sentiment. Headlines are great for traders but not so much for investors. Investors should be focused on fundamentals and taking advantage of opportunities (such as this!) when they present themselves.
The Economy

Leading economic indicators are at an all-time high. As the name implies, this index typically rolls over before a recession.
(Click on image to enlarge)
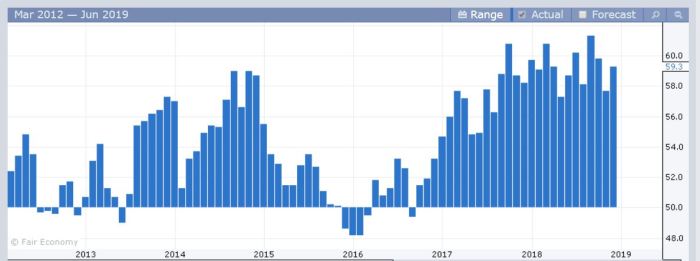
ISM Manufacturing has been steady. The last reading of 59.3 was well in expansion territory.
(Click on image to enlarge)
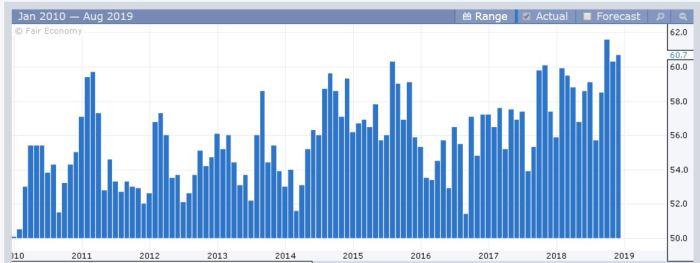
ISM Non-Manufacturing (Services) is composed of about 70% of the economic activity in the US economy. The last monthly reading of 60.7 was one of the highest on record.
(Click on image to enlarge)
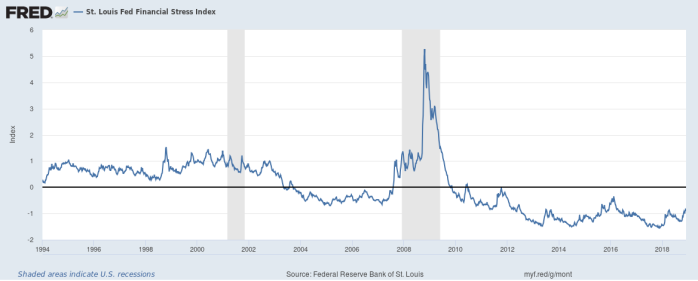
The St. Louis Fed Financial Stress Index is still negative and well below levels that would signal potential underlying issues.
(Click on image to enlarge)
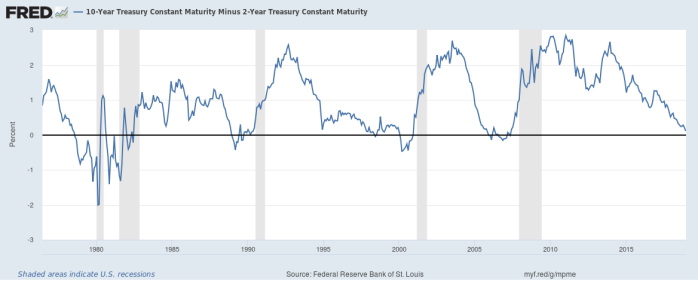
There was a lot of discussion surrounding the inversion of the 2-year and 5-year treasury yields. It’s worth noting I guess. But the most timely and reliable yield curves are still positive, although flattening. The above chart is the yield curve between 2’s and 10’s. It’s about as flat as it’s been during this current expansion. However, this yield curve was relatively flat throughout much of the mid to late 1990s. And stocks did very well.
(Click on image to enlarge)
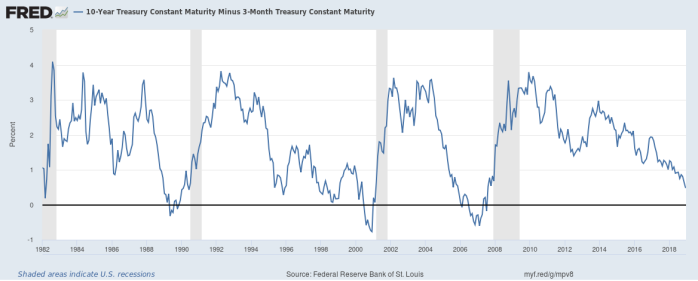
My personal favorite yield curve (3 months vs 10-year) is still relatively healthy.
Earnings
(Click on image to enlarge)
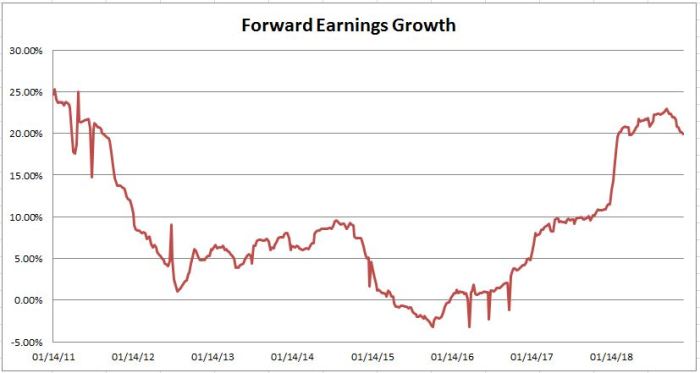
Earnings Per Share (EPS) for all companies in the S&P 500 over the next 12 months is projected to be $170.96, for a growth rate of 19.94%.
(Click on image to enlarge)
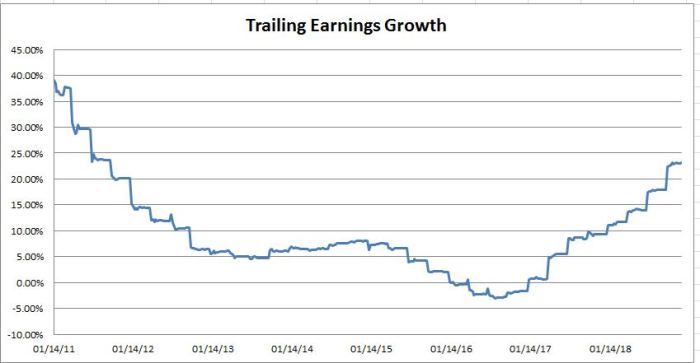
Already reported Earnings Per Share (Trailing EPS) for S&P 500 companies is $157.83, for a growth rate of 23.08%.
(Click on image to enlarge)
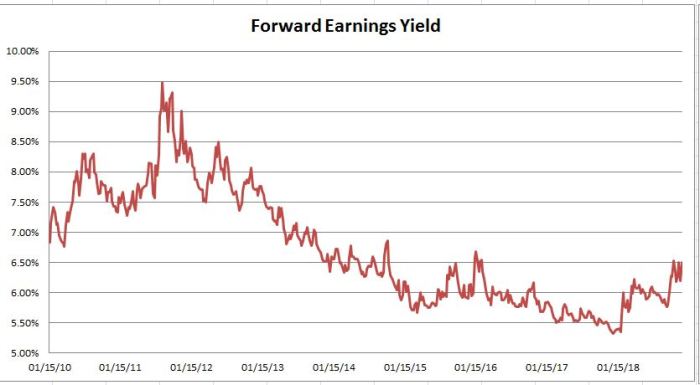
Forward earnings yield (forward EPS/SP 500) is currently 6.50%. Reaching the highs seen during the 2015-2016 market lows.
(Click on image to enlarge)
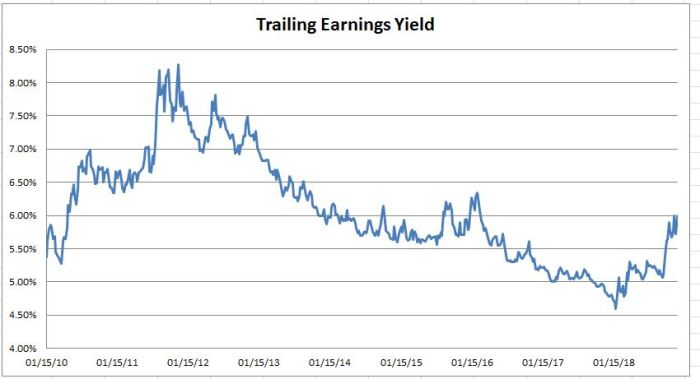
Trailing earnings yield is currently 6%. Not quite at the 2015-2016 highs, but getting close.
These yields are against the backdrop of a 10-year treasury bond that still only yields about 3%. Which leads me to valuations…
Valuations
(Click on image to enlarge)
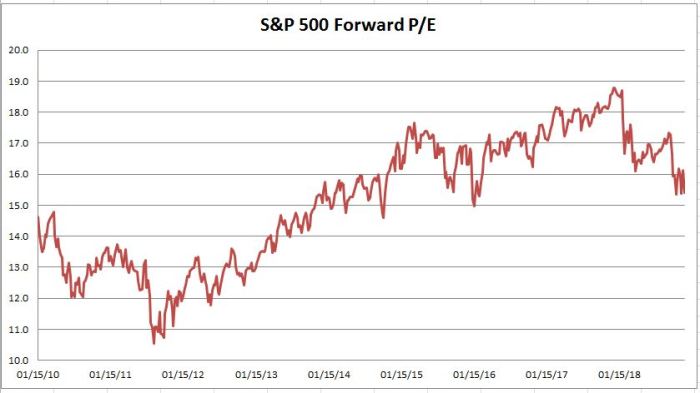
The Forward Price to Earnings Ratio (P/E) has fallen to 15.4, after reaching a high of almost 19. This is due to strong earnings growth combined with a declining stock market.
(Click on image to enlarge)

The Trailing PE is currently 16.7 after reaching a high of 22. Valuations are less expensive and closer to their historical averages. But still above long-term averages.
However, when we factor in where interest rates currently are, competition to stocks from fixed income alternatives, stocks continue to be attractively valued.
Technical Analysis
(Click on image to enlarge)
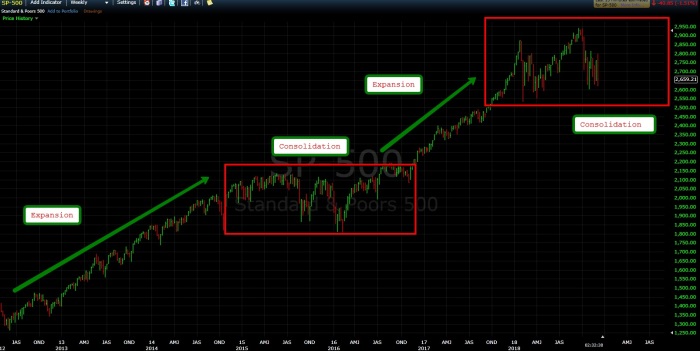
It’s important to remember during times like these that corrections are a normal part of the investment cycle. They always feel like the “end” but they almost never are without a deterioration in the fundamentals. The above chart shows the period of consolidation experienced between 2015-2016. This set up the next expansion and are necessary to keep valuations and complacency in check. This current consolidation phase will set up the next expansion.
(Click on image to enlarge)
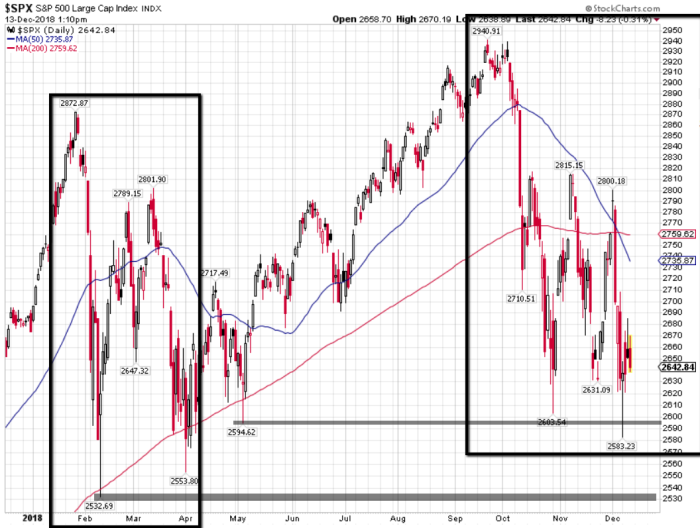
Monday’s low now matches the size of the February correction (11.8%). If the market can’t hold that low, the next downside target would be the February low of 2532.
(Click on image to enlarge)

The Advance – Decline line has displayed some relative weakness recently. But still well above the February lows, even though the S&P 500 trade within a few percents of its February lows.
It’s always concerning when every major average and the NYSE AD line is trading below their 200-day moving averages. Especially in a bull market nearing 10 years old (depending on where you measure the beginning). However, this isn’t unprecedented. It’s happened plenty of times before. What’s rarer is a long sustained bear market without a recession.
Conclusion
Investors should expect a 10-15% correction to occur every year. We’ve had two such corrections this year, but we had zero last year. This is not unusual. Use these times to look for opportunities. No one likes to see the value of their accounts decline. But the volatility is what makes stocks return more than any other asset class. This correction sounds worse than what it truly is. The Dow is down about 2% for 2018, after being up 18% last year. Stocks usually rise over time but they rarely do so in a straight line.
As for the economy, I think it’s pretty clear the economy (and earnings) will slow in 2019. But slower growth is not a recession. I want to emphasize this is not a 2008 situation. There’s no recession and the banks are much healthier. For example, last weeks reading of the services part of the economy (about 70% of the US economies annual output) was one of the highest on record and historically correspond with economic growth above 4%. When will this end? Unfortunately, no one knows that. Corrections are impossible to time with any consistency. But it will end. That much I’m certain of.
In summary, it’s never easy to endure corrections. But they do occur even in good times. It’s not unusual. It’s market crashes that are rare. 2008 style crashes have only happened 3 times in 100 years (1929, 1974, 2008), while corrections occur annually. Market crashes coincide with recessions and a recession is very unlikely in the next 12 months. We seem to be making up for the lack of volatility from last year.
Disclosure: None.
Nothing on this article should be misconstrued as investment advice. Trading and investing is very risky, please consult your investment advisor before making any ...
more

