
Yen Thrives As Sterling Selling Unabated
Quick Take
The title of today’s report embodies the exceedingly random and trendless dynamics in currency markets amid a multi-year low FX volatility regime. As a consequence of the extremely short-term flow-driven movements, courtesy of a decade low QE experiment where Central Banks have become the ultimate liquidity providers with no monetary policy divergences to take note of, and where politics is at the epicenter of the European FX moves, it’s not surprising that we see a Sterling transitioning from the absolute dominant attracting the most buying flows into the most depressed in a matter of days.
It’s the reality of the markets, which is precisely why under the current lay of the land in FX, understanding the constant fluctuation of flows through intermarket analysis gives us an advantageous front row 'VIP' seat to not miss the market’s pulse. Don't forget that. Not accepting this reality would essentially negate the regular findings I report day in and day out on strongly correlated instruments that I always emphasize and serve at your doorstep to follow the ever-evolving market's narratives.
In today’s report, I break down the anatomy of the latest market movements as usual, which are mainly characterized by the continuous dominance of the JPY and USD as macro ‘true risk off’ prevails, while the EUR and the GBP suffer the consequences of the relinquishment of the ECB’s attempt to exit QE and the Brexit unknowns. We then have the commodity-linked currencies staring at the FX show from its relatively low vol confinements.
Currency Strength Meter
The Sterling is the worst performing currency as a new week gets underway and the Brexit plot thickens without any breakthrough this far in the game of chicken. One can clearly observe through the 2nd chart below how the tendency towards the British currency has deteriorated dramatically, resulting on both micro and macro bearish trend now firmly in place. Another clear macro bearish trend since last week’s ECB catalyst is the Euro, even if the elongated nature of last Thursday’s extension has now led to a micro bull trend based on the slope of the 25-HMA.
On the opposite side, we find the Japanese Yen, emboldened not only by the intensity of ‘true risk off’ flows but also as a result of absorbing a larger share of demand on the back of a very low US NFP number last Friday. We should not ditch the USD as a more unattractive proposition for the market to diversify into but rather, at this stage, amid the lack of clear alternatives, as a firm contender to keep catching bids for the current mild bearish micro trend to re-anchor with its bullish macro trend as the 2nd chart shows.
A familiar theme that hasn’t really changed ever since the ECB-led volatility is the relatively stable performance of commodity-linked currencies, still finding pockets of demand; as the thick lines (red, blue, silver) demonstrate. The only exception, one could argue, is the tentative bullish dynamics developing in the Kiwi. As the chart on monetary policy expectations below indicates, the positive flows towards the Kiwi fall in line with the pricing out of rate cuts by the RBNZ.


source: Westpac
Narratives in Financial Markets
- Shocking miss in the US Feb NFP after a headline number of just +20k. On the bright side, the unemployment rate came down to 3.8% from 4% while earnings jumped to 3.4% vs 3.2%. Adding to the positive inputs, the January number was revised up to 311k.
- Canada’s employment change, yet again, comes exceedingly strong at 55.9k vs 1.2k exp, while the unemployment rate was unchanged at 5.8%. A surprisingly high hourly wage rate of 2.2% was also observed vs 1.7% exp, with the participation rate also up to 65.8% vs 65.6%.
- Fed Chair Powell gave a speech on Friday with the familiar mantra of ‘wait and see’ and ‘patience’ dominating the rhetoric. Importantly, he added that the bar has been set quite high for the Fed to resort to new policy strategies that make up for periods of low inflation.
- Norway’s sovereign wealth fund announced its plans to disinvest from oil and other fossil fuel related companies, weighing in the energy sector across the board.
- Fox Business reported that China’s President Xi is no longer planning to attend a trip to Trump’s Mar-a-Lago in March due to the lack of details about an eventual deal. One of the many sticking points appears to be finding an agreement in which an ‘enforcement’ of trade commitments is reciprocal and not only biased towards China respecting them. White House Economic Adviser Kudlow said the meeting may take place end of March or early April.
- Further evidence of the sharp deterioration in China’s trade data both in yuan and usd terms. Imports but especially exports suffered major slumps during Jan and Feb. In yuan terms, exports were down 16.6% y/y while in usd terms was even worse at -20.7% y/y. Meanwhile, imports were down -0.3% y/y and -5.2% y/y in yuan and usd terms respectively.
- As the endgame of the Brexit conundrum approaches, the Sterling is down considerably as the new week starts as no breakthroughs to amend the Brexit divorce agreement was found. The latest proposal by the UK was rejected by UK PM May, who faces the next vote this Tuesday, and all indications point towards another humiliating defeat north of 150 votes. Remember, there is a silver lining, as this may lead to a ‘delay’ of the Brexit process by a few months.
Recent Economic Indicators & Events Ahead


Source: Forexfactory
RORO - Risk On Risk Off Conditions
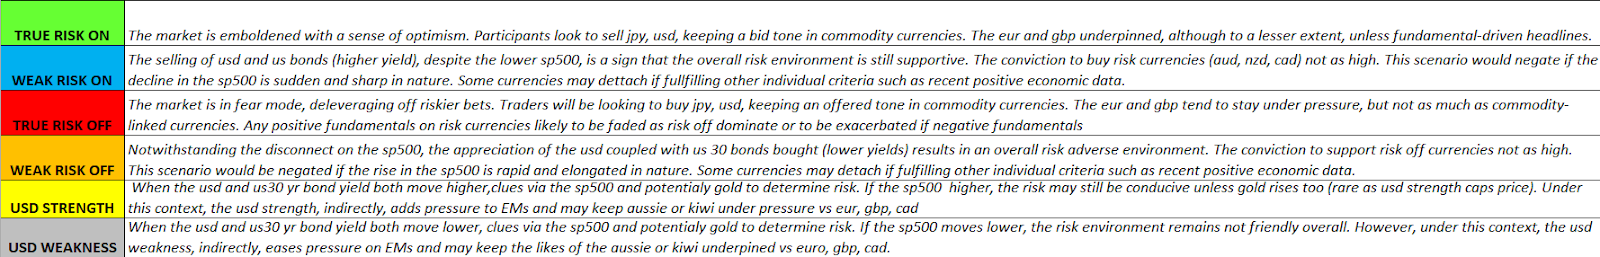

In the very short-term, the daily flows as determined by the slope of the 25-HMA indicate a context of USD weakness with balanced flows emanating out of equities as the flat 25-HMA slope shows. However, once we step out of the more noise day-to-day gyrations to instead pay attention to the macro flows determined by the last week worth of price action, the evolving trend remains firmly in place, characterized by a ‘true risk off’ scenario. The order flow, as seen via the impulsive vs corrective movements in cross-asset price action, is also indicative of a market sending ‘risk off’ signals. For instance, the last 24h pullback in the DXY occurs in the context of a move very corrective in nature, most likely led by profit-taking, in what’s otherwise a very strong bullish rally. When it comes to equities and yields, the recent deleveraging has come with downside moves being much more rapid and aggressive as opposed to slower and more two-way sided recoveries. Even the strong spike in Gold has outpaced the weakness in USD terms in the last 24h, yet again a communication that the market is looking to flock back into the appeal of the precious metal. In short, be wary of being overly aggressive towards commodity-linked FX while the Yen and the USD remain well positioned to attract positive flows, especially the former as long as equities stay under pressure.
Dashboard: Intermarket Flows & Technical Analysis


Summary: Intermarket Flows & Technical Analysis
EUR/USD: Correction Of Overstretched Move Underway
- The elongated bearish extension post ECB has found sufficient demand imbalances sub 1.12.
- The current correction in price is supported by a micro and macro turnaround in the German vs US bond yield spread, assisting to absorb the first cluster of offers through 1.1235-1.1250.
- US retail sales is up next as a vol catalyst. The data is expected to improve significantly from the previous month, which may encourage sell on strength ahead of the event.
- The underlying trend is undeniably bearish but with the bond yield spread not backing up further losses, the risk-reward to short at current levels appears dubious.
- Market makers in the options market, in tune with the more bullish backdrop in the bond market, have adjusted the pricing of calls/puts in favor of the former (EUR positive).


GBP/USD: Brexit Uncertainty Weighs On The Pound
- No breakthrough in the EU-UK Brexit talks means the market is growing impatient ahead of this Tuesday’s meaningful vote over the Brexit divorce deal, expected to fail miserably.
- The sell-off in the Sterling has decoupled from its strong correlation with the inverted DXY and the UK-US bond yield spread, arguing for value to buy on weakness…
- However, the perceived value to attempt buy-side campaign on the basis of divergence between the price and intermarket correlation is overshadowed by politics (extreme caution).
- Any further deterioration in the currency pair exchange rate should find a cluster of demand from 1.2935 as per the reference area originating from Feb 19-20.
- Any recovery in the Sterling faces very negative technicals, with a retest of 1.30 round number and above likely to see a confluence with a descending trendline off March 7th peak.


USD/JPY: Macro ‘True Risk Off’ Keeps Supply Imbalances
- With the macro backdrop still reflecting ‘true risk off’ conditions amid a micro context in which the USD is mildly lower in the last 24h, the path of least resistance is clearly lower.
- Despite the rapid overextension sub 111.00, the market is finding enough supply just above the round number, which is congruent with the deterioration in risk appetite.
- While the daily technicals are constructive as price retest a previous balance area, the current context is far from supporting follow through. Wait for equities to turn higher.
- Nonetheless, the very strong rejection off 110.80-65 demand area last Friday is a testament of the major imbalance, hence interest, that exist to still engage in buy-side campaigns.
- The huge increase in the premium to hold JPY calls in the next monthly contract is a very bad omen for the pair. The expected increase in vol reinforces the bearish outlook.


AUD/USD: Established In A Short-Term Range
- The pair finds a new range between 0.7050-0.70 with the double rejection of the former reinforcing the notion of a temporary 0.50 cents balance area to trade off.
- The macro ‘true risk off’ environment is a negative input as it’s the weakening fundamental trend in Australia with a growing number of banks calling for up to 2 rate cuts this year.
- From a macro perspective, the DXY + Yuan (inverted) performance alongside equities, still promotes sell on strength, while the AU-US bond yield spread underpins buy-side strategies.
- The options market has reverted back to price a higher premium towards Puts vs Calls in the last 24h, which adds to the overall negative dynamics as the table above shows.


USD/CAD: First Signs of Supply Entering The Market
- The contrast in US NFP vs CA jobs headline numbers led to algo-led selling, turning the micro outlook more balanced with a potential short-term range establishment.
- The options market is starting to foresee the probability of lower levels in the next monthly contract as reflected by the abrupt change in Calls/Puts pricing.
- The oil market continues to play a lower role in this market as opposed to a much more relevant role by the DXY coupled with the US-CA bond yield spread.


Important Footnotes
- Risk model: The fact that financial markets have become so intertwined and dynamic makes it essential to stay constantly in tune with market conditions and adapt to new environments. This prop model will assist you to gauge the context that you are trading so that you can significantly reduce the downside risks. To understand the principles applied in the assessment of this model, refer to the tutorial How to Unpack Risk Sentiment Profiles
- Cycles: Markets evolve in cycles followed by a period of distribution and/or accumulation. The weekly cycles are highlighted in red, blue refers to the daily, while the black lines represent the hourly cycles. To understand the principles applied in the assessment of cycles, refer to the tutorial How To Read Market Structures In Forex
- POC: It refers to the point of control. It represents the areas of most interest by trading volume and should act as walls of bids/offers that may result in price reversals. The volume profile analysis tracks trading activity over a specified time period at specified price levels. The study reveals the constant evolution of the market auction process. If you wish to find out more about the importance of the POC, refer to the tutorial How to Read Volume Profile Structures
- Tick Volume: Price updates activity provides great insights into the actual buy or sell-side commitment to be engaged into a specific directional movement. Studies validate that price updates (tick volume) are highly correlated to actual traded volume, with the correlation being very high, when looking at hourly data. If you wish to find out more about the importance tick volume, refer to the tutorial on Why Is Tick Volume Important To Monitor?
- Horizontal Support/Resistance: Unlike levels of dynamic support or resistance or more subjective measurements such as fibonacci retracements, pivot points, trendlines, or other forms of reactive areas, the horizontal lines of support and resistance are universal concepts used by the majority of market participants. It, therefore, makes the areas the most widely followed and relevant to monitor. The Ultimate Guide To Identify Areas Of High Interest In Any Market
- Trendlines: Besides the horizontal lines, trendlines are helpful as a visual representation of the trend. The trendlines are drawn respecting a series of rules that determine the validation of a new cycle being created. Therefore, these trendline drawn in the chart hinge to a certain interpretation of market structures.
- Correlations: Each forex pair has a series of highly correlated assets to assess valuations. This type of study is called inter-market analysis and it involves scoping out anomalies in the ever-evolving global interconnectivity between equities, bonds, currencies, and commodities. If you would like to understand more about this concept, refer to the tutorial How Divergence In Correlated Assets Can Help You Add An Edge.
- Fundamentals: It’s important to highlight that the daily market outlook provided in this report is subject to the impact of the fundamental news. Any unexpected news may cause the price to behave erratically in the short term.
- Projection Targets: The usefulness of the 100% projection resides in the symmetry and harmonic relationships of market cycles. By drawing a 100% projection, you can anticipate the area in the chart where some type of pause and potential reversals in price is likely to occur, due to 1. The side in control of the cycle takes profits 2. Counter-trend positions are added by contrarian players 3. These are price points where limit orders are set by market-makers. You can find out more by reading the tutorial on The Magical 100% Fibonacci Projection.
The Daily Edge is authored by Ivan Delgado, Head of Market Research at Global Prime. The purpose of this content is to provide an assessment of the market conditions. The report takes an in-depth ...
more

