
Weekly Waves: EUR/USD, Bitcoin And US30 - Tuesday, Mar. 8
Our weekly Elliott Wave analysis reviews the EUR/USD, the Bitcoin cryptocurrency, and the US30.
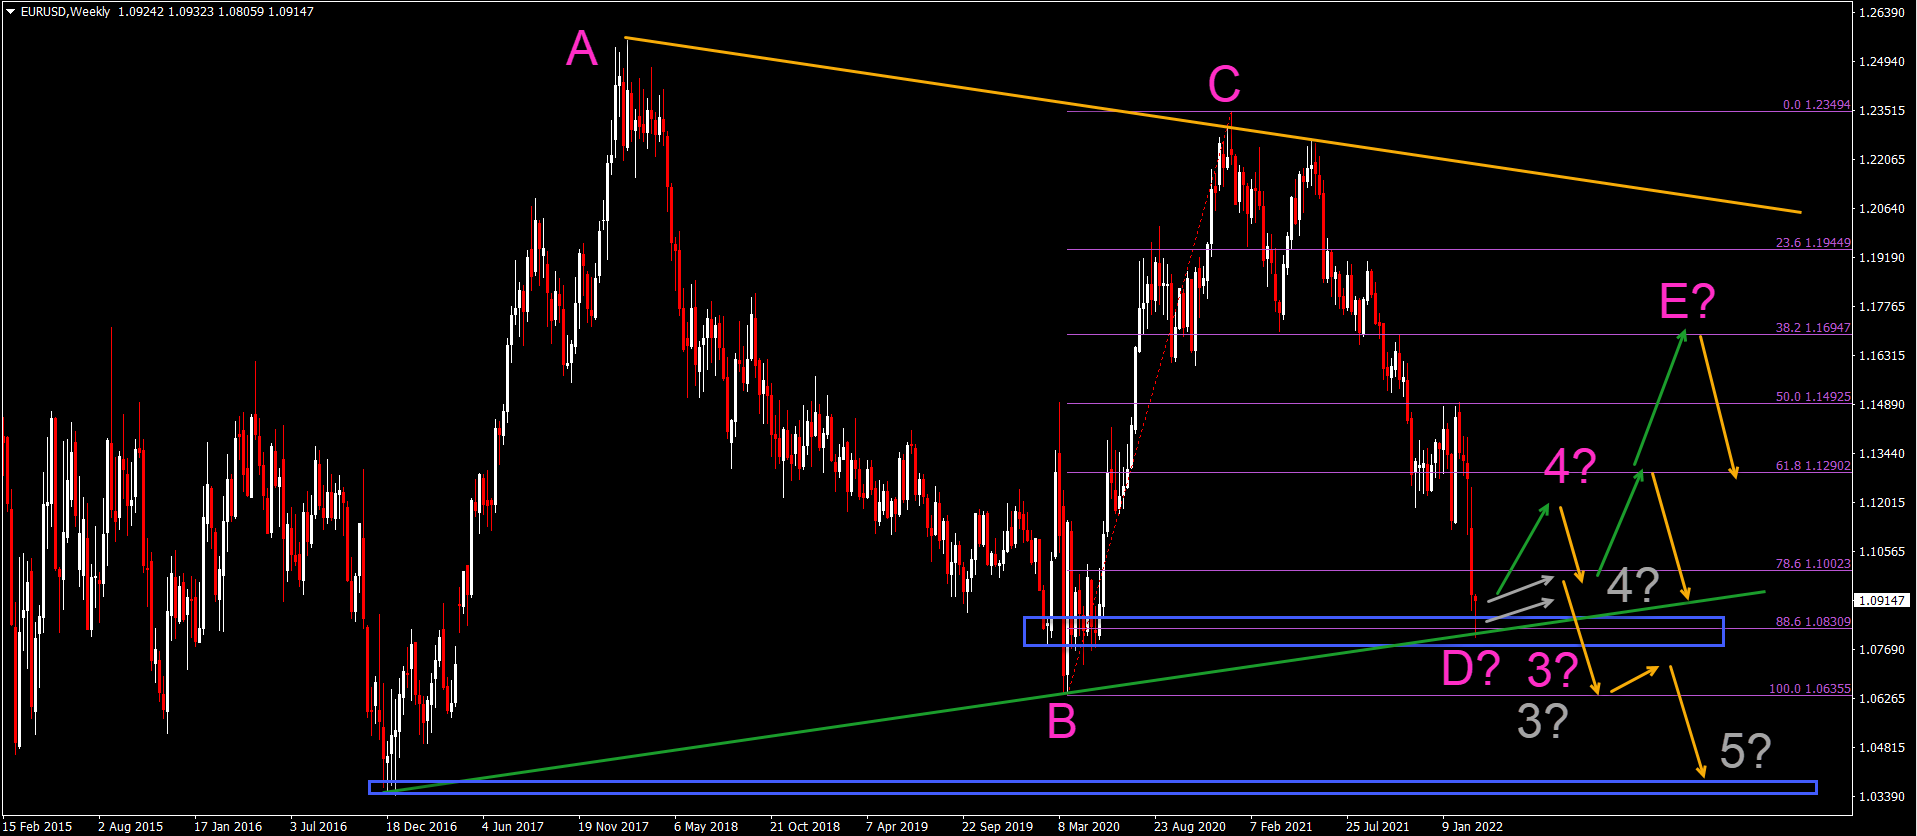
EUR/USD Breaks Bottom But Not ABC Pattern
The EUR/USD is in a free fall after dropping 700 pips from 1.15 to 1.08 in just 4 weeks:
- The EUR/USD has managed to reach the 88.6% Fibonacci retracement support level at 1.08.
- The support zone (blue box and green line) could cause the EUR/USD to pause its downtrend.
- If price action builds a bear flag pattern (grey lines), then a downtrend continuation is expected. In that case, price action is probably building a wave 3 (pink or grey). A shallow retracement indicates a wave 3 (grey) of wave 3 (pink) but a deeper retrace could indicate a wave 4 (pink) instead.
- If price action is more bullish (green arrow), then a larger bullish retracement is expected to take place. In that case, a wave D-E (pink) pattern is expected.
- An immediate break below the support zone could indicate an immediate downtrend.
(Click on image to enlarge)
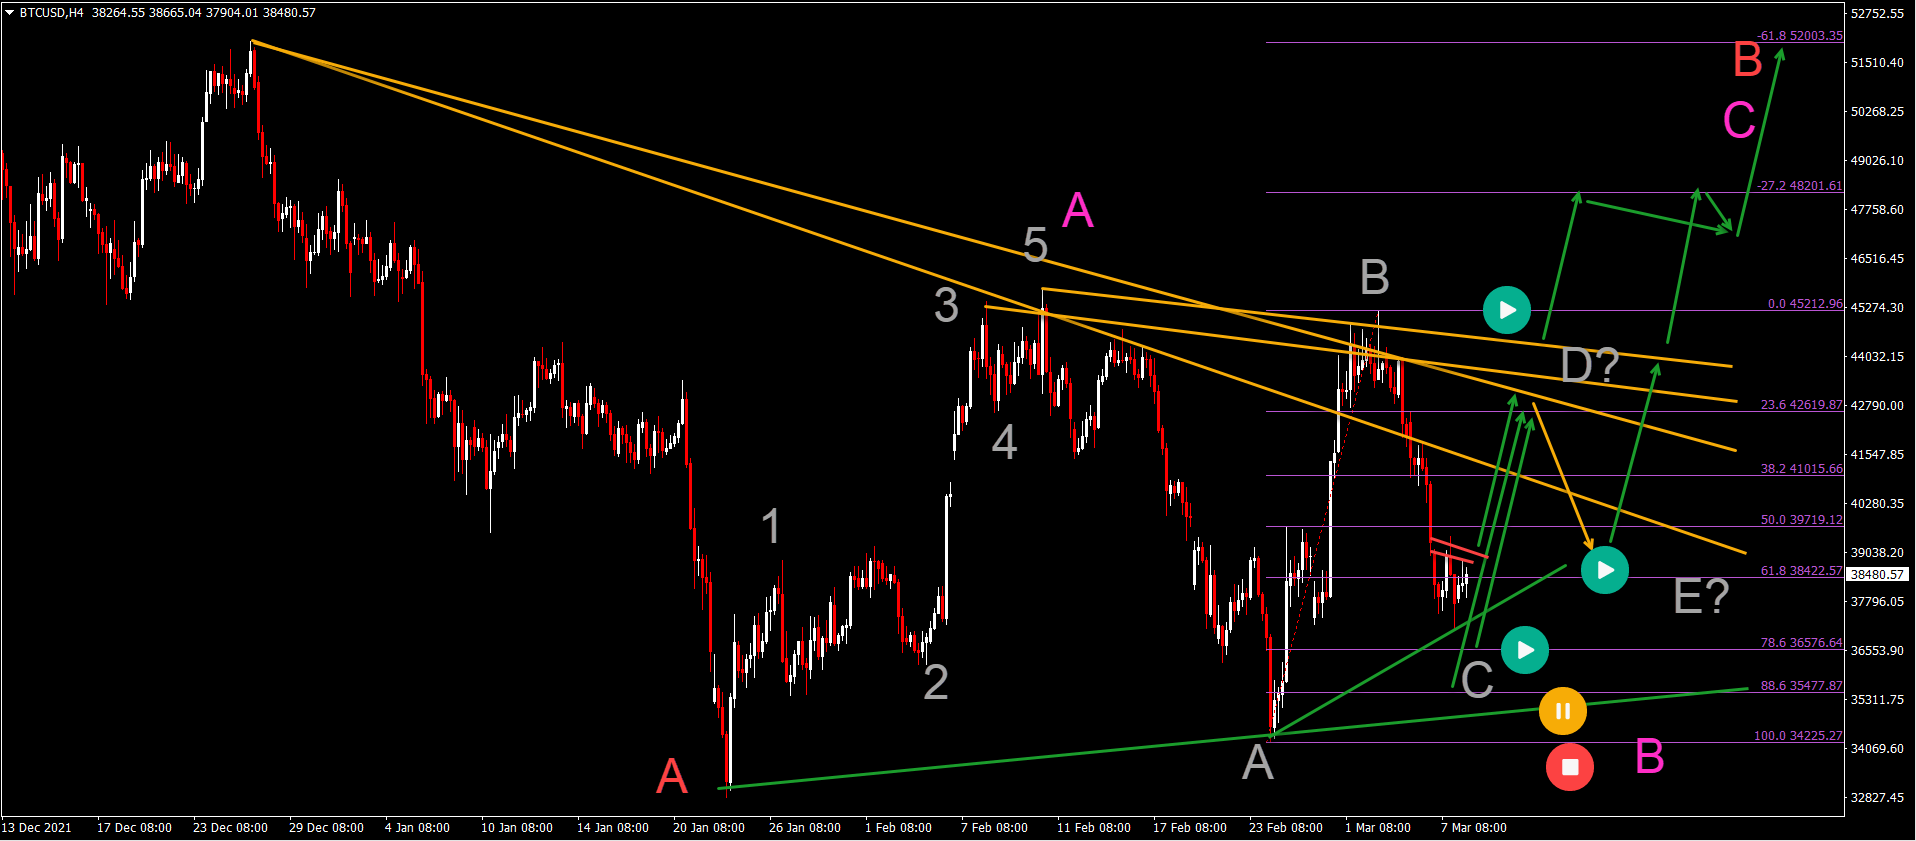
BTC/USD Bullish Bounce at 88.6% Fibonacci Level
The Bitcoin crypto pair (BTC/USD) made a huge bullish bounce up but price action was unable to break above the resistance (orange):
- BTC/USD has probably made a wave B (gray) at the lower high.
- This wave B (gray) seems to be part of a larger ABC (gray) pattern within a wave B (pink).
- A deeper bearish retracement could take place if price action stays below the local resistance zone (red lines).
- But the Fibonacci levels are expecting to be a support zone if price action indeed completed a wave A (pink) impulse.
- A bullish price swing could test the resistance trend lines (orange). A bearish bounce indicates the potential for an ABCDE triangle (gray).
- A bullish breakout is part of a wave C (pink) in wave B (red).
(Click on image to enlarge)
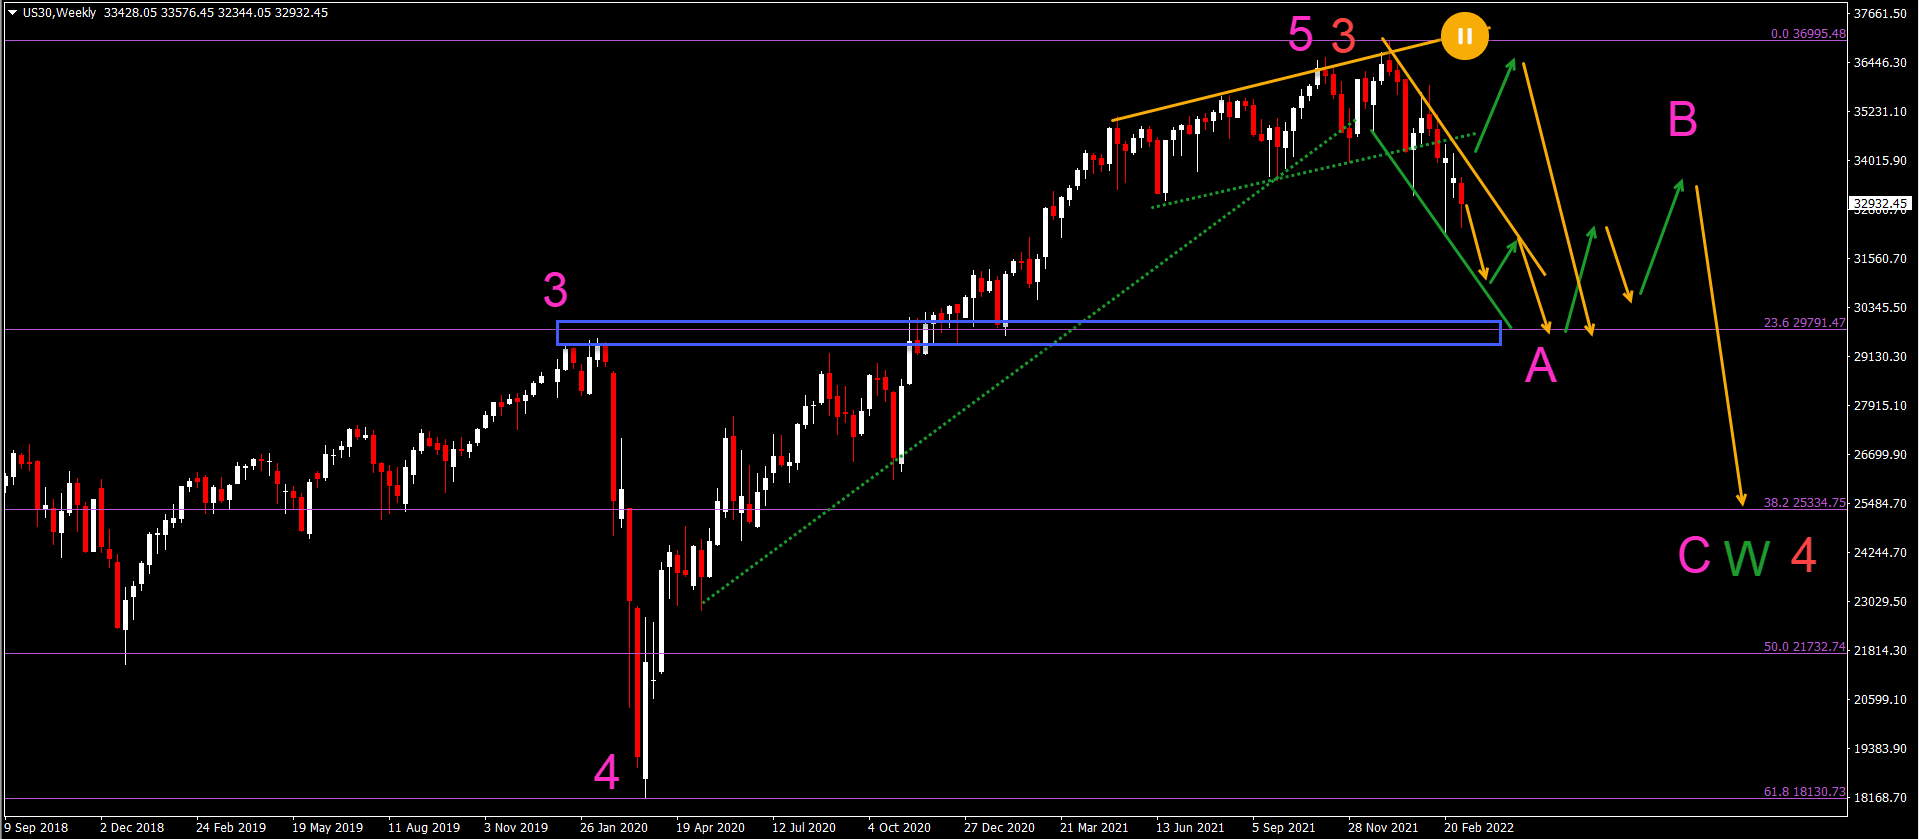
US30 Breaks Bottom and Starts Downtrend
The US30 is in a downtrend channel after breaking below the support zone (dotted green lines):
- The US30 weekly chart seems to be building a bearish retracement or reversal after being in a long-term uptrend.
- The wave 5 (pink) of wave 3 (red), however, seems completed and price action is retracing within a potential wave 4 (red).
- The retracement could go as far as the 23.6% Fibonacci level which could provide a bounce back up.
- An ABC (pink) pattern could take price action back as low as the 38.2% Fibonacci retracement level.
- The ABC (pink) pattern could be part of a complex wave W (green).
(Click on image to enlarge)
Disclaimer: CFDs are complex instruments and come with a high risk of losing money rapidly due to leverage. On average around 80% of retail investor accounts loose money when trading with high ...
more
How did you like this article? Let us know so we can better customize your reading experience.

Comments
Leave a comment to automatically be entered into
our contest to win a free Echo Show.

