
Weekly Waves: EUR/USD, Bitcoin And US30 - Monday, May 9
Our weekly Elliott Wave analysis reviews the EUR/USD 4-hour chart, the Bitcoin cryptocurrency weekly chart, and US30 on the weekly chart.
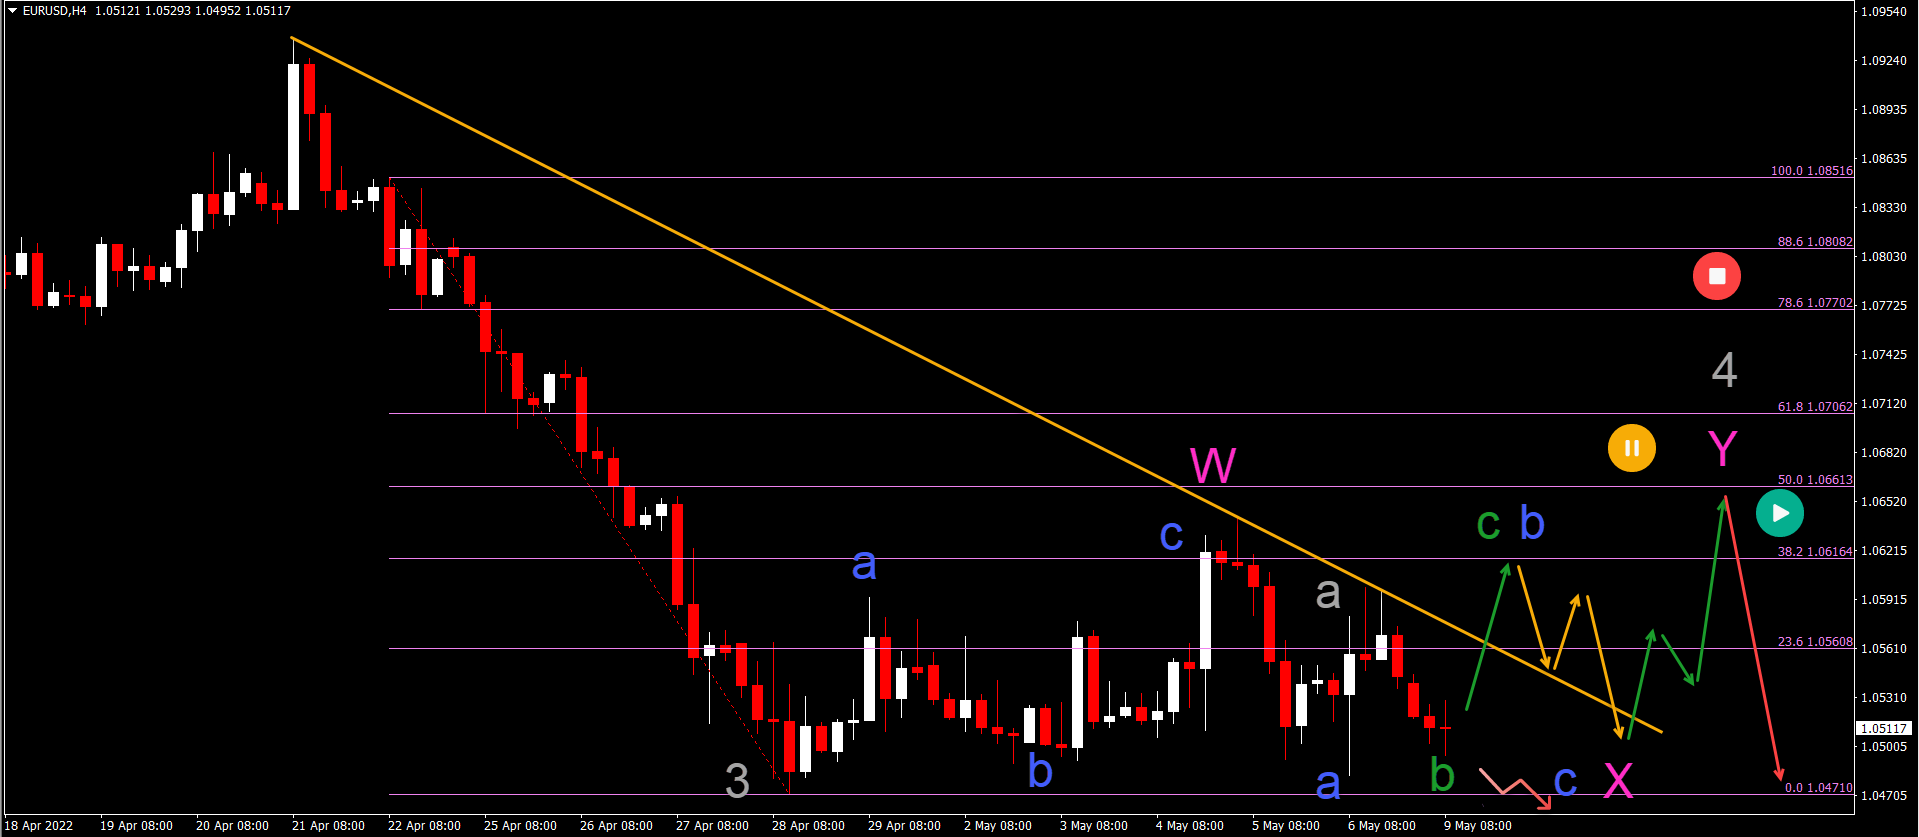
EUR/USD Complex Correction
The EUR/USD is testing a key support zone again. The main question is whether the EUR/USD makes a bearish breakout:
- The EUR/USD wave pattern suggests that a longer and complex chart pattern is expected to take place.
- The downtrend however is expected to remain valid after the correction is completed.
- A bearish breakout would invalidate the complex correction but confirm the immediate downtrend.
- If a bullish bounce does occur, then wave C (green) can develop within wave B (blue).
- A larger ABC (blue) would finish wave X (pink) of a larger wave Y (pink) of wave 4 (gray).
- Wave 4 (gray) may not correct above the 50% Fibonacci, otherwise, it is likely to actually be a wave 4.
- Once the downtrend restarts, the main targets are expected 1.0375, 1.0325, 1.025, and even 1.00.
(Click on image to enlarge)
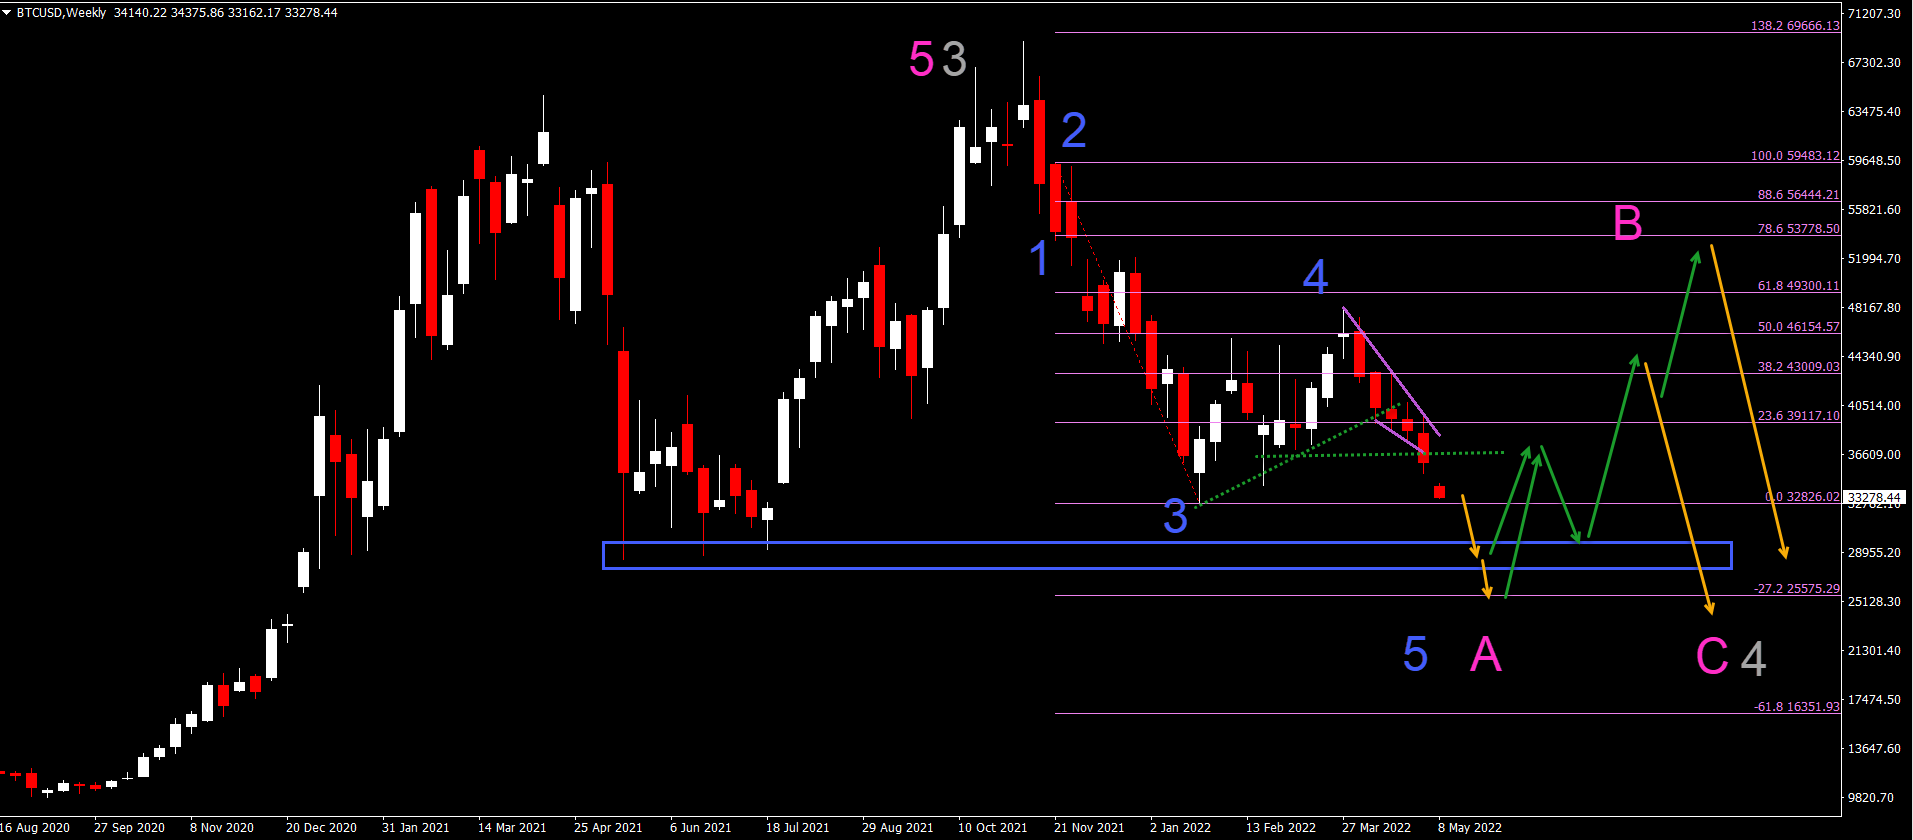
BTC/USD Key Bearish Breakout
Bitcoin (BTC/USD) has made a bearish breakout and pushed below the support trend lines (dotted green):
- The BTC/USD bearish breakout invalidates the expected bullish complex correction of last week.
- The Elliott Wave analysis has been therefore changed to reflect the new bearish breakout. The current view is a 5-wave (blue) pattern within wave A (pink).
- A larger ABC (pink) pattern could unfold within a wave 4 (gray) or within a wave W of a larger WXY.
- The main bearish target of wave 5 (blue) is the support zone (blue box) or the -27.2% Fibonacci target.
(Click on image to enlarge)
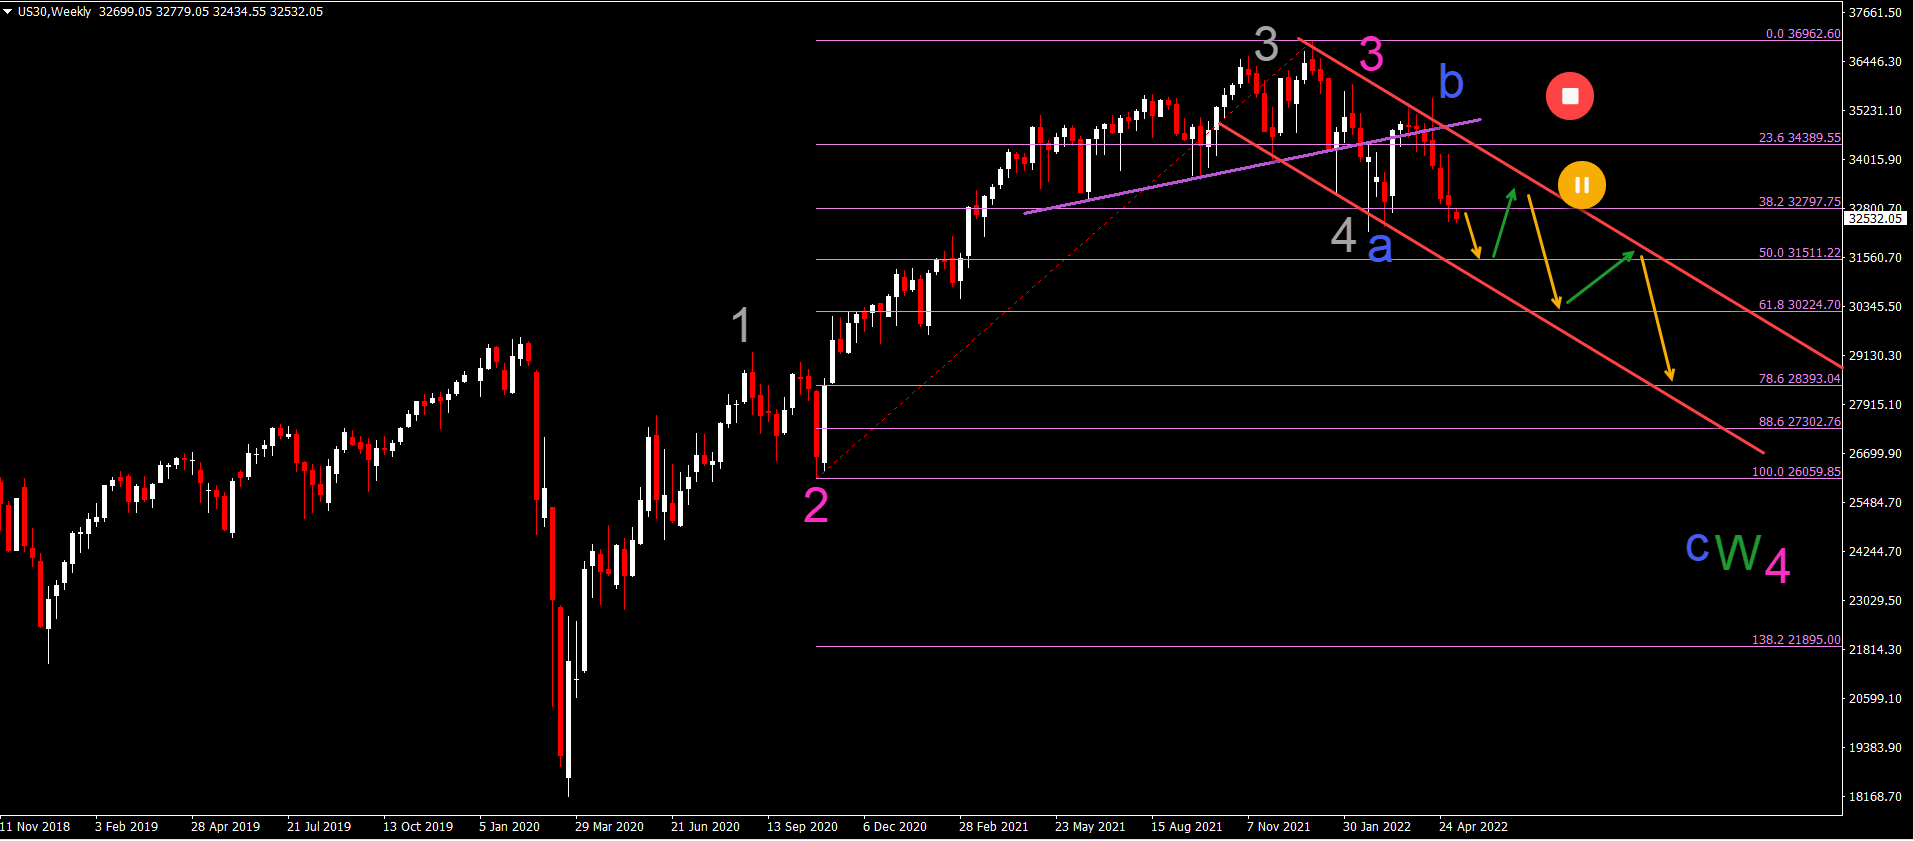
US30 Downtrend Channel Emerges
The US30 remains bearish too, as expected in our analysis last week:
- The US30 had again a bearish weekly candle. The high of the candle tested the resistance of the previous weekly high but saw a serious sell-off.
- A bearish push towards the 50% Fibonacci level is now expected (orange arrow).
- A bullish retracement could take place at the Fibonacci levels (green arrows) but ultimately, a larger bearish retracement is expected.
- If price action stays above the 50% Fibonacci level, then a wave 3-4 (gray) is still possible.
- But a break below the 50% Fib indicates a deeper ABC (blue) correction within wave W (green) of wave 4 (pink).
(Click on image to enlarge)
Disclaimer: CFDs are complex instruments and come with a high risk of losing money rapidly due to leverage. On average around 80% of retail investor accounts loose money when trading with high ...
more
How did you like this article? Let us know so we can better customize your reading experience.

Comments
Leave a comment to automatically be entered into
our contest to win a free Echo Show.

