
Weekly Technical Perspective On The British Pound (GBP/USD) - Tuesday, July 10
In this series, we scale-back and take a look at the broader technical picture to gain a bit more perspective on where we are in trend. Here are the key targets & invalidation levels that matter on the weekly chart for the British Pound vs US Dollar (GBP/USD).
GBP/USD WEEKLY PRICE CHART
(Click on image to enlarge)
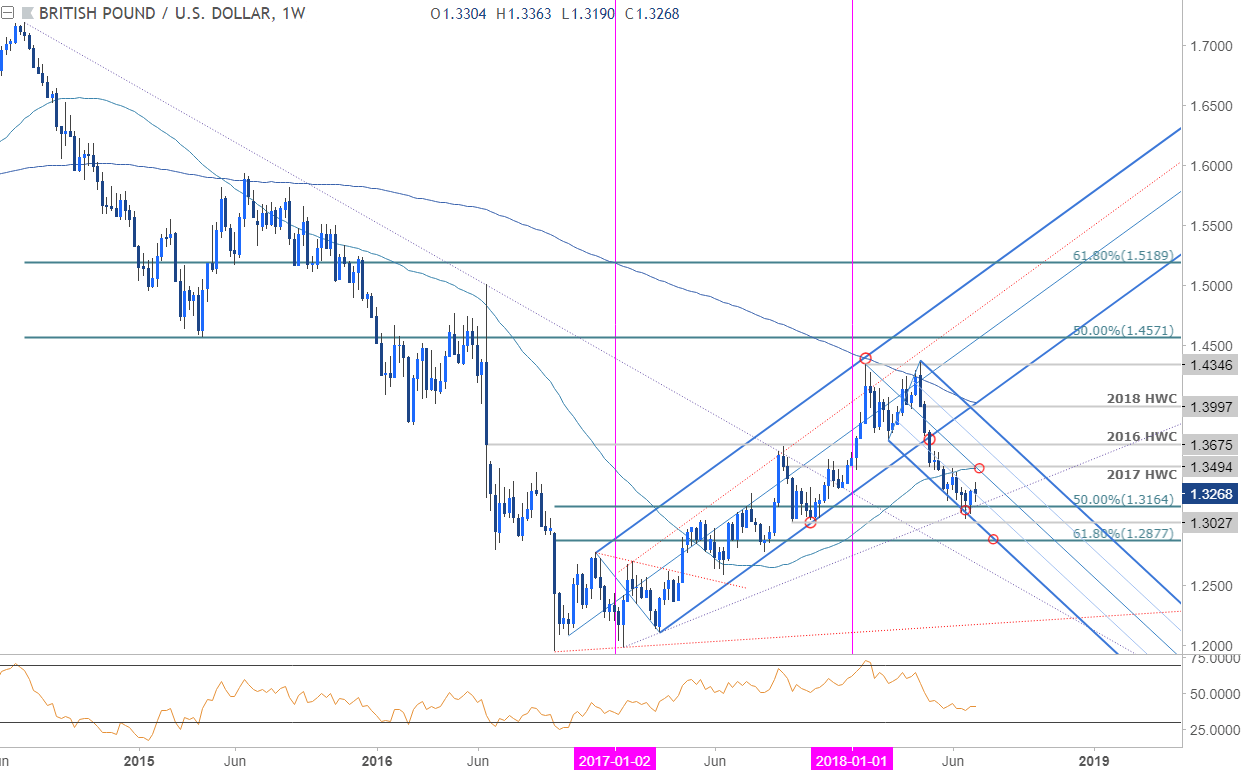
Notes: In last month’s Weekly Technical Perspective on the British Pound, we highlighted a critical support zone in GBP/USD at, “around ~1.3164. This region is defined by the 50% retracement of the post-Brexit advance and converges on the lower median-line parallel & basic trendline support extending off the 2017 lows. So was that the low?”
So far, so good! Multiple attempts have failed to close below this threshold with Sterling rallying more than 2% off the lows. But with the recent shake-up in the UK government threatening an orderly Brexit, the pair is once again on the defensive. That said, the technical focus has not changed and while price could still see some downside near-term, the broader focus is against this key support zone.
Weekly resistance remains steady at the confluence of the median-line, the 2017 high-week reversal close and the 52-week moving average at 1.3480/94. Note that weekly RSI is attempting to stabilize above 40 here and further highlights how pivotal of a level this is. A break sub-40 in momentum alongside a move sub-1.3164 in price would expose subsequent support objectives at 1.3027 and the 61.8% retracement at 1.2877.
Bottom line: The broader decline off the yearly highs remains at risk while above this support confluence. From a trading standpoint, I’ll be looking for exhaustion on a pullback to offer entries while above 1.3164.I’ll publish a scalp update once we get some structure in near-term price action but daily trade levels are largely unchanged from my previous GBP/USD Technical Outlook.
GBP/USD TRADER POSITIONING
(Click on image to enlarge)
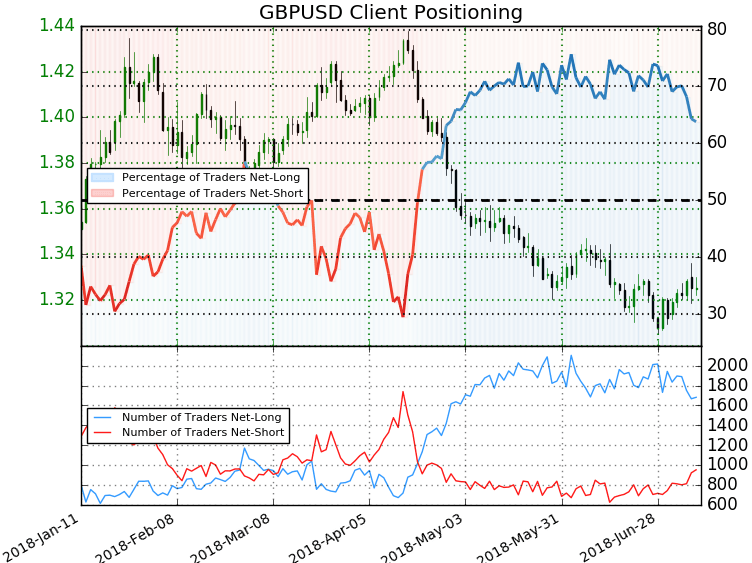
- A summary of IG Client Sentiment shows traders are net-long GBP/USD- the ratio stands at +1.76 (63.8% of traders are long) – bearish reading
- Traders have remained net-long since April 20th; price has moved 5.9% lower since then
- Long positions are 5.0% lower than yesterday and 11.6% lower from last week
- Short positions are1.7% higher than yesterday and 16.4% higher from last week
- We typically take a contrarian view to crowd sentiment, and the fact traders are net-long suggests GBP/USD prices may continue to fall. Yet traders are less net-long than yesterday and compared with last week. Recent changes in sentiment warn that the current GBP/USD price trend may soon reverse higher despite the fact traders remain net-long.
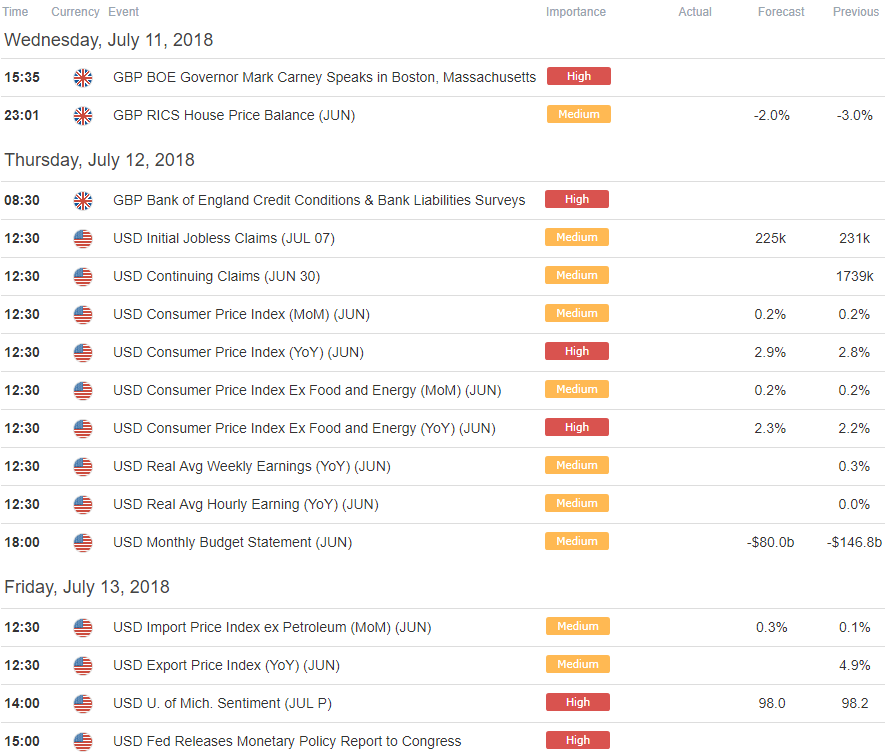
RELEVANT GBP/USD DATA RELEASES
(Click on image to enlarge)
Disclosure: Do you want to see how retail traders are currently trading the US Dollar? Check out our IG Client Sentiment ...
more

