

True to form, the markets are seeing the pull of holiday liquidity kicking in and having its expected influence over the top benchmarks. Historically, the 51st week of the year sees a market slowing of implied (‘expected’) volatility which is well established through the averages from the VIX volatility index. And, that tempo only fades further moving into the final week. There remain a number of open threads in the speculative conversation (interest rate speculation, recession fears, etc) that can disrupt the market with limited prompt or even no warning; but the seasonal trends are seasonal for a reason. Taking a look to the popular ‘fear index’ this past session, there was a 1.4-point drop (-6.6 percent) from the measure to just above the 20 handle. That is both a measure that significantly neutralizes many traders’ fear that unseasonable conditions are lurking without being so low as to suggest there is extraordinary complacency that can suddenly catch the market off guard – and thereby prompt a ‘mean revision’. Perhaps a little more remarkable is the VVIX ‘volatility of volatility’ measure which has dropped back to the general lows seen stretched back over the past 8 years. That doesn’t necessitate the market normalize, but it does add to the ill-prepared picture of how markets may react when liquidity is restored.
Chart of the VIX Overlaid with the VVIX Volatility of Volatility Index (Daily)
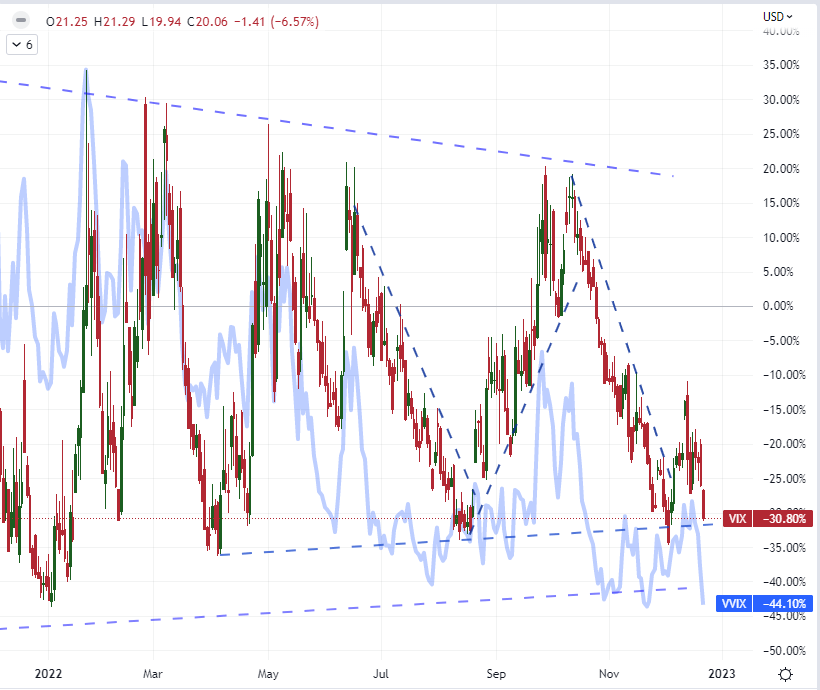
Chart Created on Tradingview Platform
Normally, the reflection between the S&P 500 and VIX starts with the view of the index marking a move and the derivative implied volatility measure drawing from its development. That makes sense mathematically; but thematically, I believe the relationship to have inverted. The lack of surprise through scheduled event risk or speculative intent allows for the seasonal norms to play out. That temperance would throttle back on the market’s ability to turn the fundamental run of this past week (FOMC and PMIs particularly) into a lasting bear trend. Without that self-sustaining concern to keep the decline under power, the overlapping Fibonacci support around 3,800 (the 38.2% of the post-pandemic range, 38.2% of the August – October leg and 50% of the October – December rebound) managed to hold up. The path of least resistance from there is a move back into range. The question on my mind is how strong is the restriction on activity as to escalate the influence of technical levels. The previous range floor through much of November and December complimented by the mind point of the August-October range is above around 3,910. Will it hold against this bounce? Volume’s slide suggests it is a good probability.
Chart of the S&P 500 with Volume (Daily)
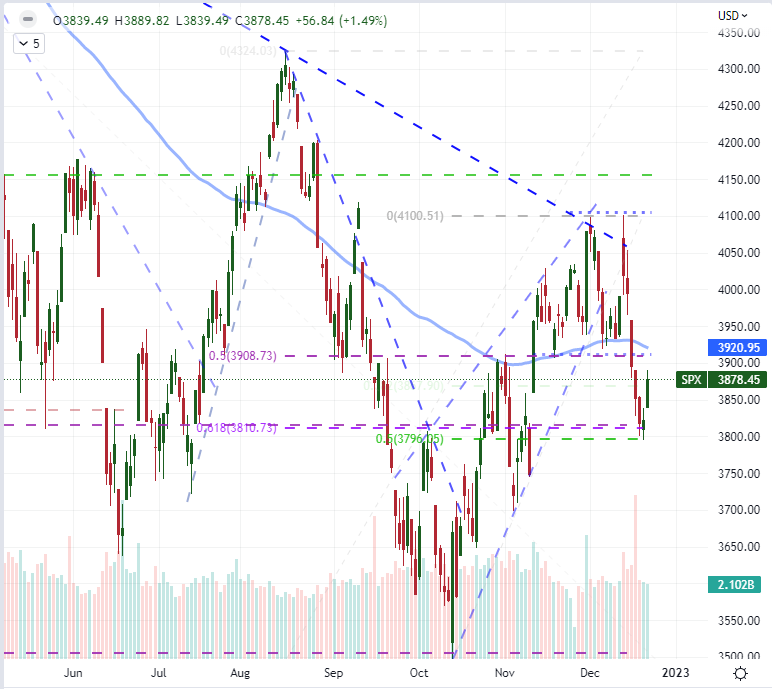
Chart Created on Tradingview Platform
As restricted as the technical picture looks with something like the S&P 500, there are even more extreme conditions in the deeper waters – the kind of quiet that could force a ‘normalizing’ in activity that translates into a short-term break. The Dollar has witnessed activity drop off in a technically precarious point. The Greenback has drooped these past few months to potentially change a long-term bull trend that led to multi-month highs. Yet the bearish wedge that has created on the Dollar has tightened to the point of reaching a virtual ‘terminal point’ where a break is almost a necessity as it runs out of room. For a few of the USD-based majors like GBPUSD and NZDUSD with head-and-shoulders patterns, we have seen a slip that tentatively slips the ‘necklines’. However, if you project this technical event as a clear sign of follow through, you are not working with the market’s given probabilities. We won’t know the balance of follow through or false-break-reversal until liquidity is reliable restored. Meanwhile, EURUSD has not given any relief – disputed or not. This past session, the benchmark currency pair dropped recorded its narrowest daily range 0.5 percent of spot since the July 4th holiday. A break – even one of necessity – is likely, but keep in mind the capacity of follow through.
Chart of the EURUSD with 20-Day SMA, 30 Period ATR and Historical Range (4 Hour)
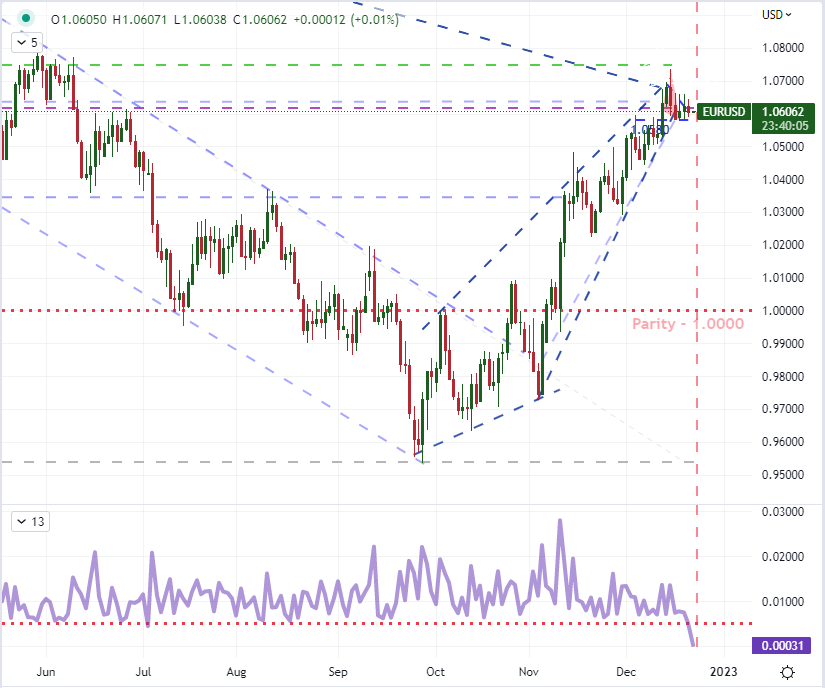
Chart Created on Tradingview Platform
Looking for meaningful events on the docket ahead, Thursday is not sporting the most productive events. There are a few stand outs with the US National Activity Index from the Chicago Fed and US Lending Index from the Conference Board which will be on my radar. They will speak to recession risks going forward, and the Conference Board’s consumer sentiment survey this past session offered some notably relief on that front – though we get none of that from market measures like the ‘2-10 spread’. The top event on the immediate horizon is the PCE deflator on Friday. That’s the Fed’s favorite inflation indicator which could generate some last minute volatility, but there is very limited time to make anything out of meaningful surprises (if they were to occur) before the liquidity drains for the holiday weekend.
Top Macro Economic Event Risk for the Next 72 Hours
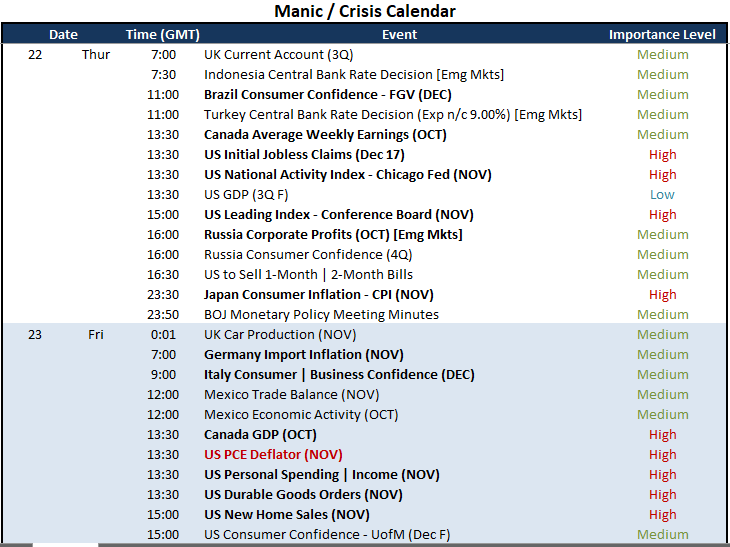
Calendar Created by John Kicklighter
More By This Author:
USD/JPY Bearish Break Was Dramatic, But Liquidity Can Tame Even That Move
EUR/USD Forecast: Euro Bolstered By GfK Consumer Confidence
FTSE 100, DAX 40 And Dow Jones Industrial Average Reversing Into Large Ranges


Comments
Log in or sign up to join the conversation.