
USD/JPY Rally To Persist As RSI Sits In Overbought Territory
USD/JPY clears the 2002 high (135.16) ahead of the Federal Reserve interest rate decision as the central bank is widely expected to implement higher interest rates, and the exchange rate may attempt to test the October 1998 high (136.89) as the Bank of Japan (BoJ) plans to “conduct an additional outright purchase of Japanese government bonds (JGBs)” on June 14.
The announcement suggests Governor Haruhiko Kuroda and Co. will have to further utilize their non-standard tools in 2022 as the central bank retains the Yield-Curve Control (YCC) program, and the diverging paths between the BoJ and the Fed may continue to push USD/JPY to multi-decade highs as Chairman Jerome Powell and Co. warn that “a restrictive stance of policy may well become appropriate depending on the evolving economic outlook.”
(Click on image to enlarge)
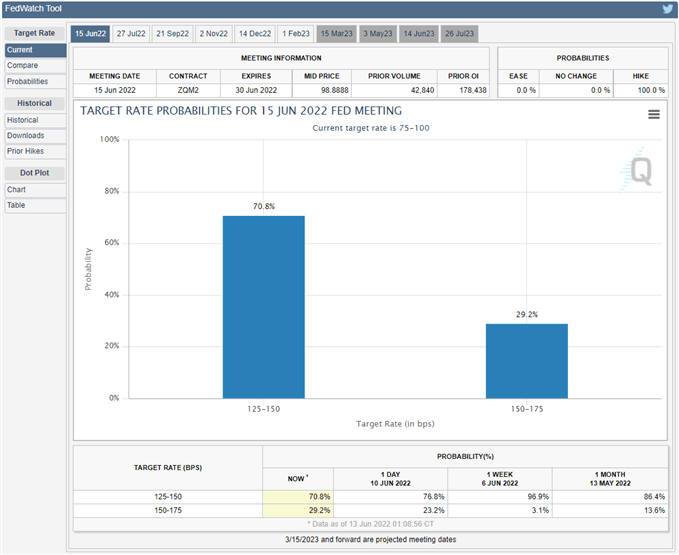
Source: CME
As a result, the Federal Open Market Committee (FOMC) looks poised to deliver at least another 50bp rate hike on June 15 as the CME FedWatch Tool reflects a greater than 20% chance for a 75bp hike, and it remains to be seen if the central bank will adjust the forward guidance for monetary policy as Chairman Powell and Co. are slated to update the Summary of Economic Projections (SEP).
Until then, a further rise in US yields may keep USD/JPY afloat as the BoJ remains reluctant to shift gears, and the tilt in retail sentiment looks poised to persist as traders have been net-short the pair for the majority of 2022.
(Click on image to enlarge)
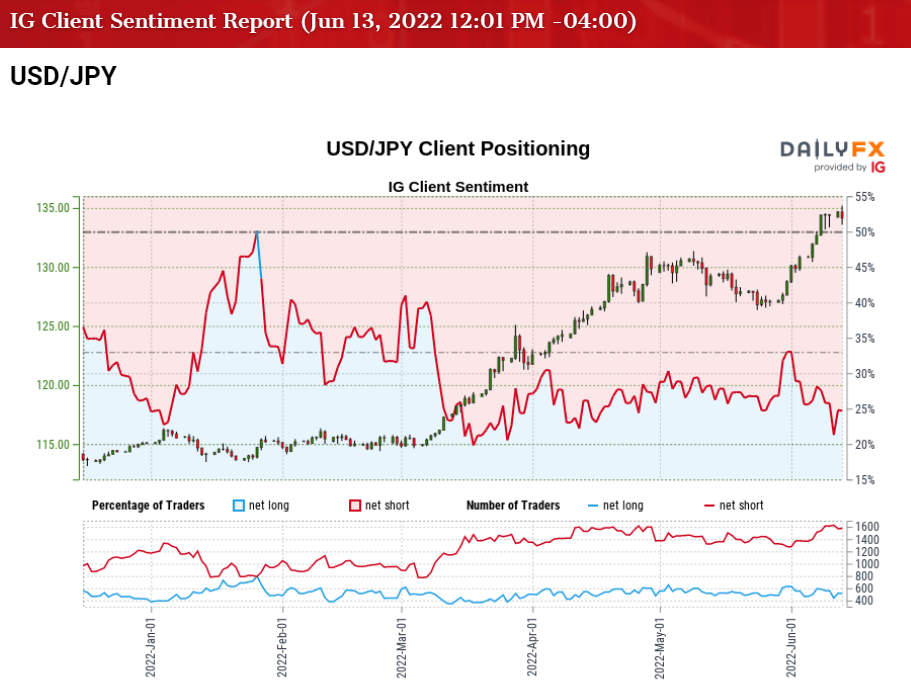
The IG Client Sentiment report shows only 24.37% of traders are currently net-long USD/JPY, with the ratio of traders short to long-standing at 3.10 to 1.
The number of traders net-long is 5.66% lower than yesterday and 5.33% lower from last week, while the number of traders net-short is 5.08% higher than yesterday and 10.71% higher from last week. The decline in net-long position comes as USD/JPY clears the 2002 high (135.16), while the rise in net-short interest has fueled the crowding behavior as 31.51% of traders were net-long the pair at the start of the month.
With that said, USD/JPY may attempt to test the October 1998 high (136.89) as the FOMC is expected to further normalize monetary policy in June, but a move below 30 in the RSI is likely to be accompanied by a near-term pullback in the exchange rate like the price action seen earlier this year.
USD/JPY Rate Daily Chart
(Click on image to enlarge)
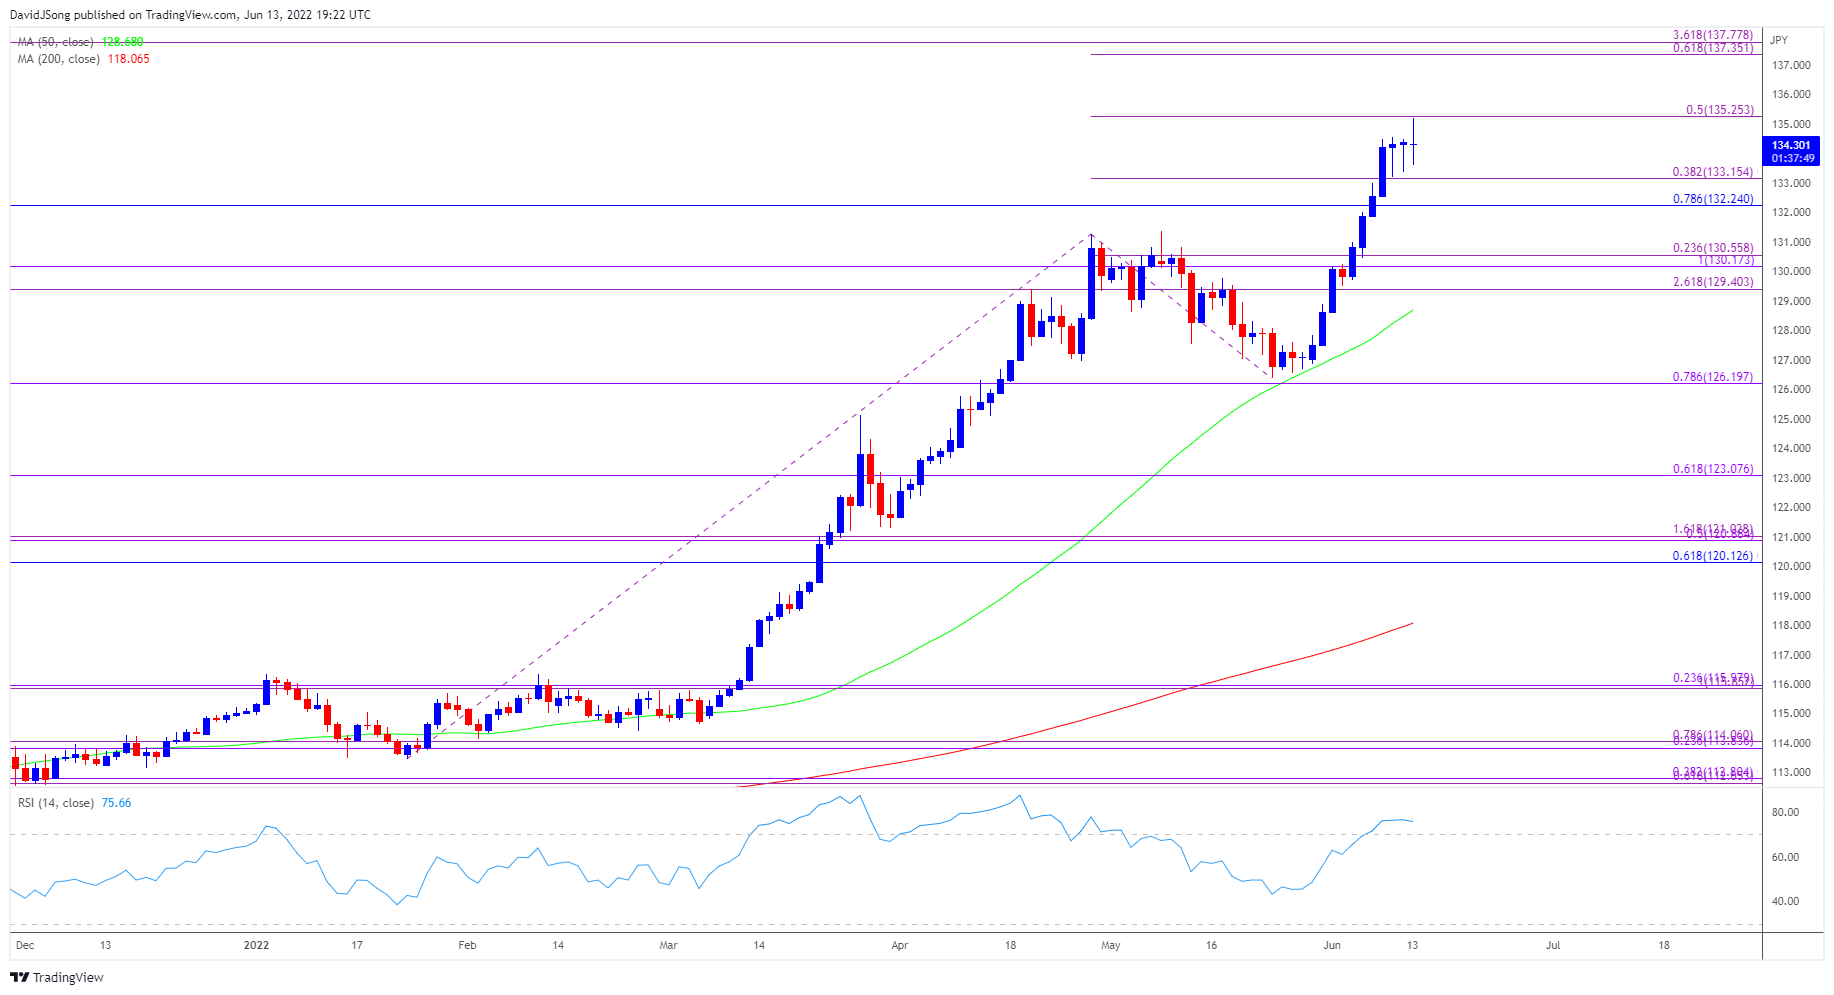
Source: Trading View
- USD/JPY clears the 2002 high (135.16) after reversing ahead of the 50-Day SMA (128.68) in May, and the exchange rate may continue to track the positive slope in the moving average as it trades to a fresh yearly high (135.20).
- USD/JPY may attempt to test the October 1998 high (136.89) as the Relative Strength Index (RSI) sits in overbought territory, but need a break/close above the 135.30 (50% expansion) region to open up the Fibonacci overlap around 137.40 (61.8% expansion) to 137.80 (361.8% expansion).
- However, failure to break/close above the 135.30 (50% expansion) region may lead to a near-term pullback as USD/JPY struggles to extend the series of higher highs and lows from the start of the month, with a move below 70 at the RSI likely to be accompanied by a decline in the exchange rate like the price action seen earlier this year.
- Lack of momentum to hold above the Fibonacci overlap around 132.20 (78.6% retracement) to 133.20 (38.2% expansion) may push USD/JPY towards the 130.20 (100% expansion) to 130.60 (23.6% expansion) area, with the next region of interest coming in around 129.40 (261.8% expansion).
Disclosure: See the full disclosure for DailyFX here.


