
USD/CNH Gains, Yuan Weakens As Risk Aversion Runs On Trump Tariffs
TRUMP TARIFFS INCREASED AT MIDNIGHT AFTER LACK OF PROGRESS
It’s been a busy week across global markets with a number of headline items and price action themes of interest punctuating the backdrop. While themes of risk aversion have remained, the FX market has been relatively quiet, generally speaking. The notable exception to that has been two of the major currencies in Asia, as the anti-risk Yen has been very strong while the Yuan has been very weak, catching another gust of selling in the overnight session as US tariffs on China increased at midnight.
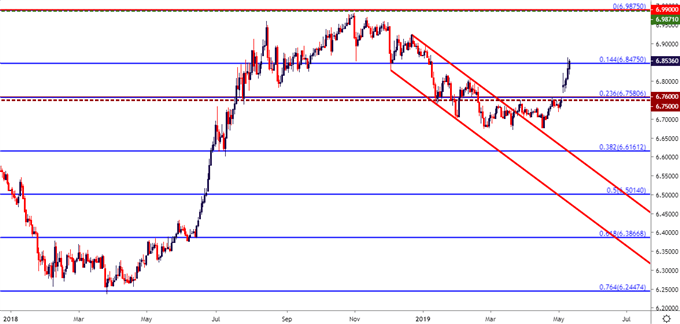
This continues what’s been a very strong week in USD/CNH. The pair gapped-higher to open trade, and that theme has continued with prices rallying back-above the 6.85 handle. The wide expectation here is that China will look to offset this additional friction imposed by tariffs with looser monetary policy, which could further equate to Yuan weakness and, perhaps, even allow for an eventual break of the 7.0000 psychological level.
USD/CNH DAILY PRICE CHART
(Click on image to enlarge)
CAN YUAN WEAKNESS AND TRADE FRICTION FURTHER THE PUSH OF RISK AVERSION?
CNH weakness provoking a larger risk-off response through global markets is not unprecedented. Something similar happened in August of 2015 when China shocked markets by devaluing their currency as the IMF was evaluating the Yuan for inclusion in the Special Drawing Rights (SDR) basket; and in short order global equity markets had started to turn lower. That risk-off theme held into 2016 trade, until the Humphrey Hawkins testimony in February, at which point Janet Yellen opened the door to the possibility of looser monetary policy to offset any potential complications that may arise. Given that interest rates were near zero at the time, this amounted to the possibility of negative rates at the FOMC. This provided a quick boost to risk markets and that lasted into the Presidential Election, at which point an entirely new theme took over.
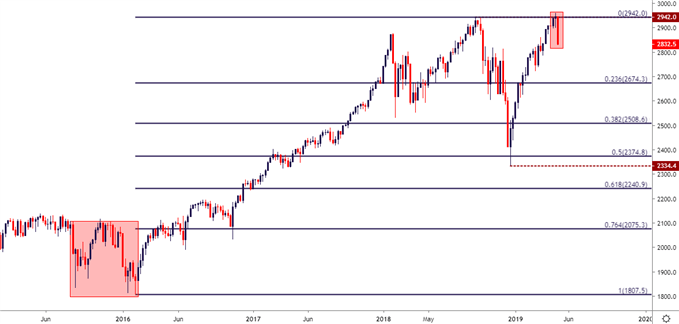
On the weekly price chart, the S&P 500 has formed an evening start pattern, which will often be followed for bearish reversal potential.
S&P 500 WEEKLY PRICE CHART
(Click on image to enlarge)
IS A LESS-DOVISH FOMC ON TOP OF TRADE FRICTION TOO MUCH FOR RISK MARKETS?
Risk aversion showed-up again in Q4 and this was taking place as the trade dispute remained in full bloom. But another factor of concern began to permeate the backdrop when Jerome Powell alluded to a continued pace of hawkishness at the Fed.
The FOMC has hiked interest rates eight times since Trump was elected in November of 2016, running in stark contrast to the one rate hike that had been seen in the prior eight years. This was coupled with balance sheet reduction, in which the Fed let maturing bonds roll-off of the portfolio, amounting to an element of dual-tightening in rates within the US economy.
It can take time for interest rate hikes to filter through the economy. Inflation had started to fall in August and September of last year, and as the door opened into Q4 in October, the Fed remained hawkish, looking to further hike rates into 2019. This was evidenced through a comment from FOMC Chair, Jerome Powell, in which he was asked about the bank’s proximity to the neutral rate, which is the theoretical level at which policy is neither simulative nor restrictive; similar to a ‘goldilocks’ rate for a Central Bank. Chair Powell opined that he thought the Fed was ‘a long way’ from the neutral rate, indicating an increased scope of expansion for rate hikes into the New Year. In short-order, stocks turned and that theme ran aggressively into the Christmas Holiday.
S&P 500 DAILY PRICE CHART
(Click on image to enlarge)
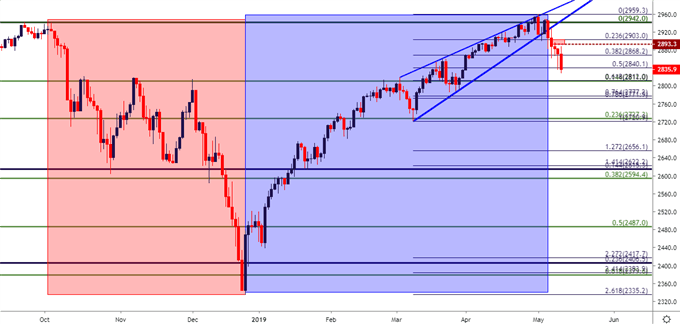
Like a light switch being flipped back on, bulls returned to the party after Christmas, evoking an aggressive topside rally that ran through April trade. The S&P 500 retraced the entirety of Q4’s losses, and then some, as the index set a fresh all-time-high just last week.
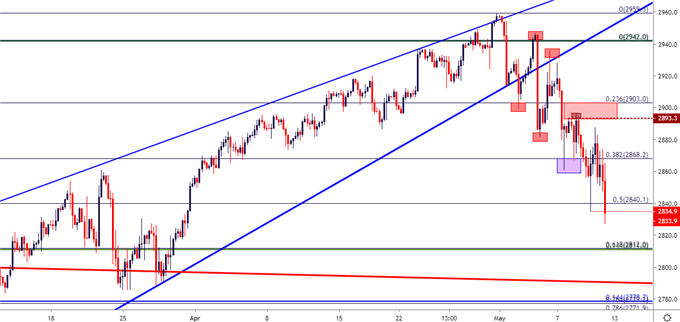
Since then, matters have begun to shift. It was around the FOMC rate decision when that began to show, as the Fed wasn’t quite as dovish as many had expected. Odds for a rate cut by the end of 2019 were as high as 68% before that meeting. After, odds had dipped down to around 50%, largely driven by the fact that Jerome Powell did not talk up the prospect of looser monetary policy. This created a quick move of weakness in US indices, and after a Friday rally brought-in a lower-high, bears have been back on the attack this week, assisted with trade tensions further muddying the economic backdrop.
S&P 500 FOUR-HOUR PRICE CHART
(Click on image to enlarge)
YEN STRENGTH TO GO ALONG WITH RISK AVERSION THEMES
In the FX-world, the US Dollar remains relatively quiet, all factors considered. The Japanese Yen, however, has been strong throughout this week, with some remaining unfilled-gap in pairs like USD/JPY, EUR/JPY and GBP/JPY. This illustrates just how aggressive that risk-off theme has been in the Yen this week, and this can keep the door open for potential continuation scenarios.
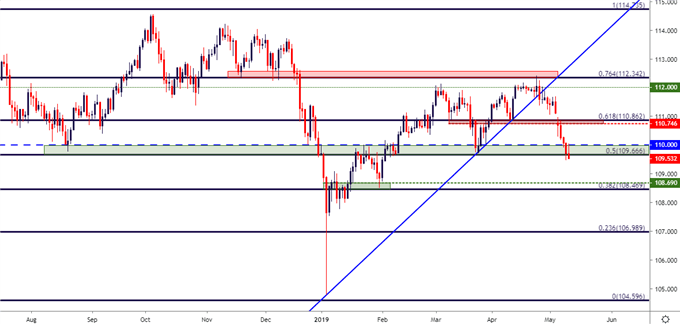
In USD/JPY, prices are holding on to a key area of support in a zone that runs from 109.67-110.00. A push below this zone opens the door for a test of a deeper zone that’s around 100 pips lower, running from 108.47-108.69.
USD/JPY DAILY PRICE CHART
(Click on image to enlarge)
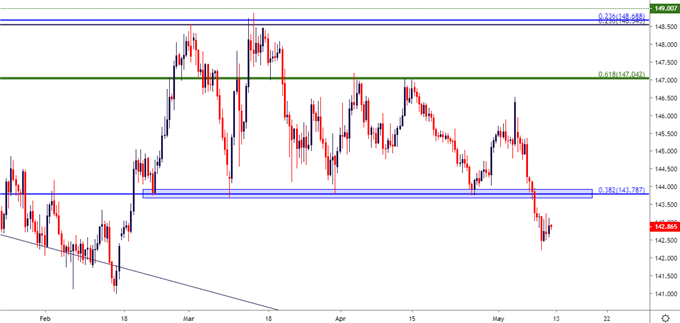
In GBP/JPY, the pair broke below a big support level this week at 143.79. This is the 38.2% retracement of the 2016-2018 major move in the pair, and this level had previously helped to hold the lows on four separate occasions over the past three months. Sellers have thus far been thwarted around the 142.50 psychological level, and this could lead to a backdrop in which prior support could be re-engaged as lower-high resistance potential.
GBP/JPY FOUR-HOUR PRICE CHART
(Click on image to enlarge)
Another pair of interest for continued risk aversion, AUD/JPY did fill its gap earlier this week, prodded in part by a less-dovish RBA rate meeting than what many were expecting. But, that didn’t stop the sell-off in the Aussie, particularly against the Yen as those risk-aversion flows in JPY pushed the pair down to fresh three-month-lows in follow-thru price action this week.
AUD/JPY EIGHT-HOUR PRICE CHART
(Click on image to enlarge)
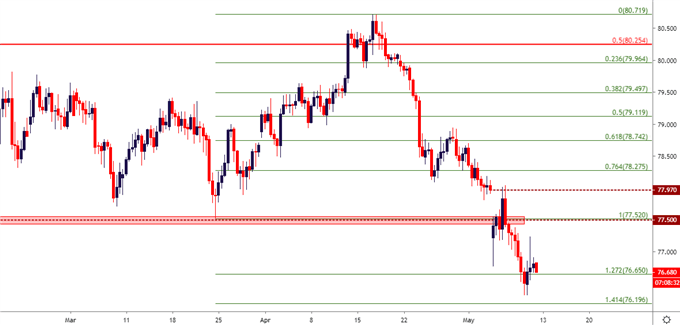
Chart prepared by James Stanley


