
(Click on image to enlarge)

On the current USDCAD chart, we see the internal structure of a large correction pattern similar to a cycle triple zigzag w-x-y-x-z.
Now the final actionary sub-wave z is being built. This waves takes the form of a primary double zigzag Ⓦ-Ⓧ-Ⓨ, where the sub-waves Ⓦ-Ⓧ are formed.
Thus, at the moment it is possible that the last actionary primary wave Ⓨ is under construction.
It could end in the form of a double zigzag (W)-(X)-(Y) near 1.403. At that level, cycle wave z will be at 161.8% of cycle wave y.
(Click on image to enlarge)
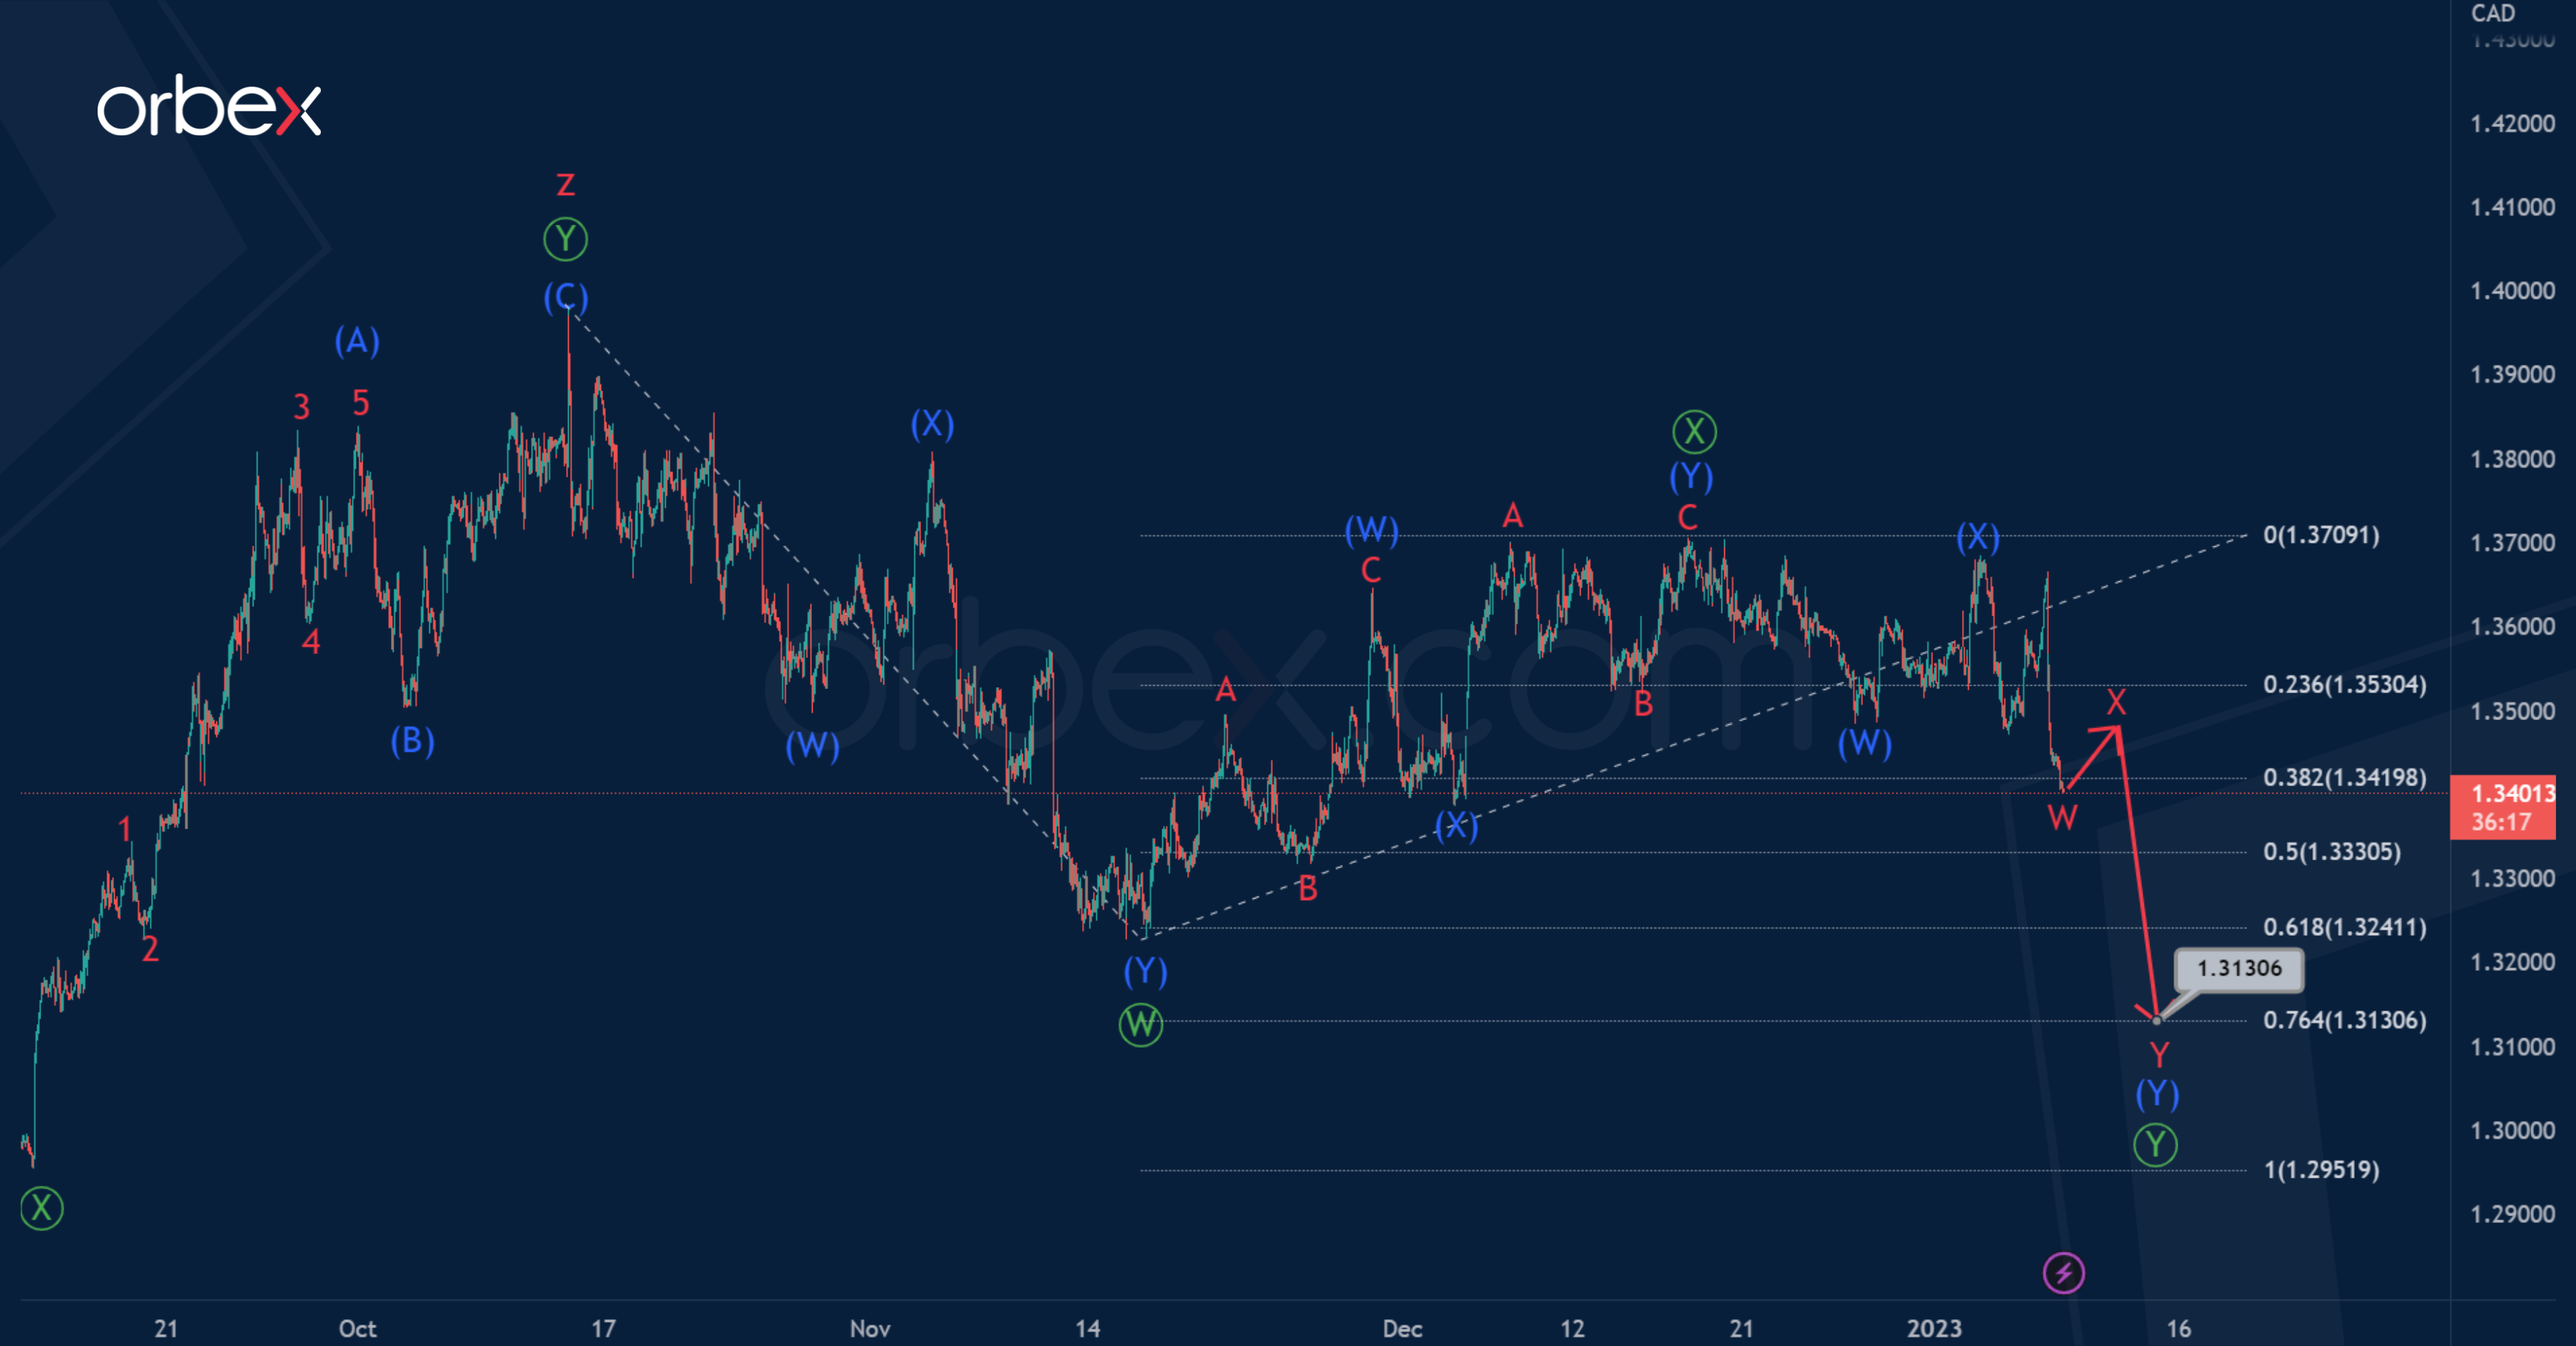
According to an alternative, the formation of a cycle triple zigzag could be fully completed. Therefore, now the initial part of a new bearish trend can be built.
We assume the construction of a primary double zigzag Ⓦ-Ⓧ-Ⓨ, which is the beginning in a larger correction pattern.
It is likely that the primary waves Ⓦ-Ⓧ-Ⓨ have ended.
We can expect a continuation of the bearish primary wave Ⓨin the near future. This could take the form of a double zigzag (W)-(X)-(Y) and end near 1.313. At that level, it will be at 76.4% of primary wave Ⓦ.
More By This Author:
Intraday Market Analysis – USD Tests Key Supports
Can Canadian Jobs Numbers Change The BOC’s Mind?
USD Bounces Back – Intraday Market Analysis


Comments
Log in or sign up to join the conversation.