
USD Price Outlook: US Dollar Trading Ranges & Implied Volatility
I pointed out in Thursday’s US Dollar Price Volatility Report that USD price action could benefit from a protracted extension higher. This expectation was largely predicated on resurfacing downside risk faced by the Euro amid rising uncertainty stemming from trade uncertainty and the outstanding threat that Trump may slap additional tariffs on the EU goods.
The release of worse-than-expected preliminary Eurozone PMI data from IHS Markit for November might serve as another fundament driver that explains Friday’s sharp drop in spot EUR/USD prices and surge in the DXY Index. November US PMI data topped consensus estimates on both services and manufacturing, which is detailed on the DailyFX Economic Calendar.
US DOLLAR INDEX PRICE CHART: DAILY TIME FRAME (MAY 10, 2019 TO NOVEMBER 22, 2019)
(Click on image to enlarge)
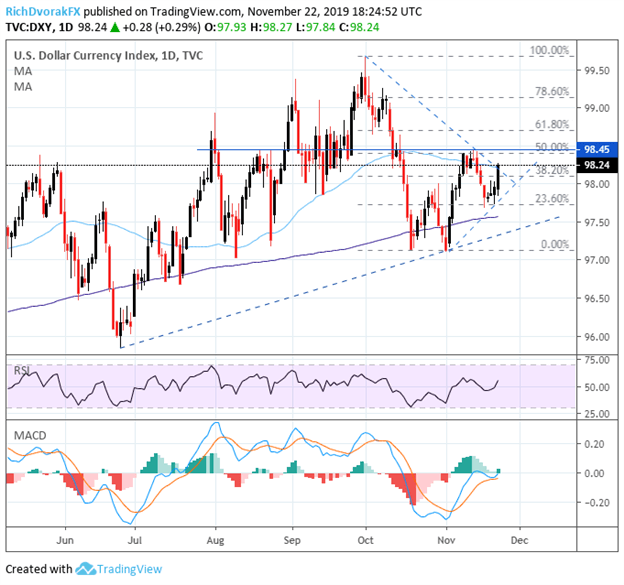
Chart created by @RichDvorakFX with TradingView
The jump in the US Dollar has pushed the DXY Index to test the downtrend resistance line extended from the October 01 and November 13 swing highs in addition to its 50-day simple moving average. A continued advance in USD price action could see the broader US Dollar Index retest the zone of confluent resistance near the 98.45 area where the month-to-date high currently resides.
While this zone of technical resistance has potential to prevent further upside in the US Dollar, the MACD indicator highlights bullish divergence. Topping the 98.45 level may open up the door to target the 61.8% Fibonacci retracement of the US Dollar’s recent bearish leg before the 99.00 handle and 78.6% Fib come into focus. Technical support could be provided by the short-term uptrend line connecting the November 01 and November 21 swing lows as well as the 200-day SMA.
US DOLLAR IMPLIED VOLATILITY & TRADING RANGES (1-WEEK)
(Click on image to enlarge)
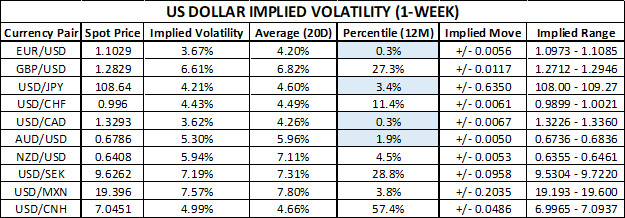
It goes without saying that expected forex volatility is incredibly suppressed judging by 1-week options implied volatility readings across major US Dollar currency pairs. Specifically, 1-week EUR/USD implied volatility of 3.67% is the lowest on record dating back to 1999. On a similar note, 1-week implied volatility for USD/CAD is at its lowest level since 2014.
Likewise, 1-week implied volatility on USD/JPY and AUD/USD readings of 4.21% and 5.30% respectively appear exceptionally low. That said, I am watching for a potential spike in currency volatility, which could create a major tailwind for USD price action in light of the US Dollar’s posturing as a safe-haven currency. Spot GBP/USD is anticipated to be the most volatile G7 currency next week with an implied volatility of 6.61%.


