
USD Price Outlook: US Dollar Selling Subsides - Levels To Watch

US DOLLAR OUTLOOK: USD PRICE ACTION STAGES RELIEF BOUNCE AS IMPLIED VOLATILITY ACCELERATES
- USD price action edged modestly higher throughout Tuesday’s trading session
- US Dollar Index advanced 0.2% as the Greenback gained against the Pound Sterling
- Implied FX volatility has accelerated recently in an ominous disconnect from the VIX
The US Dollar turned slightly higher on Tuesday with the DXY Index notching a 0.2% gain. USD price action appreciated across the board as the Pound-Dollar dropped while USD/CAD climbed 26-pips and 20-pips respectively. The moves look driven by Brexit headlines weighing negatively on the cable and traders laying off exposure to the Canadian Dollar headed into the BOC rate decision scheduled for Wednesday, 09 December at 15:00 GMT.
DXY - US DOLLAR INDEX PRICE CHART: DAILY TIME FRAME (24 AUG TO 08 DEC 2020)

Chart by @RichDvorakFX created using TradingView
The latest advance by USD price action thus looks fueled largely by its counterparts rather than US Dollar-specific drivers. This is helping facilitate a relief bounce by the broad-based DXY Index. The US Dollar recoiling higher off its lower Bollinger Band likely serves as a constructive technical development for bulls, which brings the 23.6% and 38.2% Fibonacci retracement levels of the latest leg lower into focus as potential short-term upside objectives. On the other hand, if US Dollar selling pressure resumes, the 90.50-price level on the DXY Index might be looked toward as a possible technical support zone. Breaching this barrier of defense could open up the door to another stretch of US Dollar weakness.
USD PRICE OUTLOOK - US DOLLAR IMPLIED VOLATILITY TRADING RANGES (OVERNIGHT)
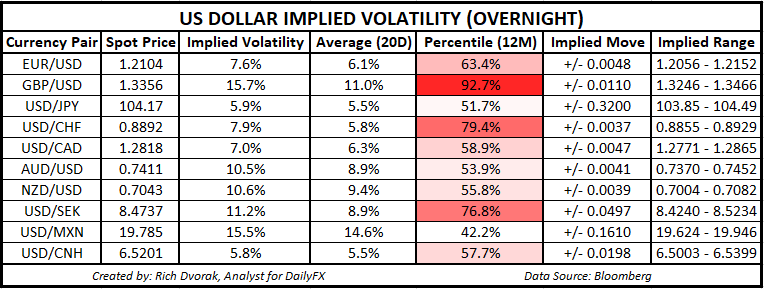
Learn More - What is Implied Volatility & Why Should Traders Care?
With Brexit trade talks heating up as the deadline for a deal quickly approaches, it comes as little surprise that the Pound-Dollar is expected to be the most active major currency pair. GBP/USD overnight implied volatility of 15.7% ranks in the top 90th percentile of readings clocked over the last 12-months, and it is also considerably above the 20-day average reading of 11.0%. USD/CAD price action could also steal the spotlight during Wednesday trade considering the Bank of Canada interest rate decision on deck, which could fuel volatility in the Loonie.
USD/CADMIXEDData provided by IG
| CHANGE IN | LONGS | SHORTS | OI |
| DAILY | 8% | 2% | 6% |
| WEEKLY | 8% | 20% | 11% |
US DOLLAR INDEX IMPLIED VOLATILITY & VIX INDEX OVERLAID: DAILY TIME FRAME (01 JAN TO 08 DEC 2020)
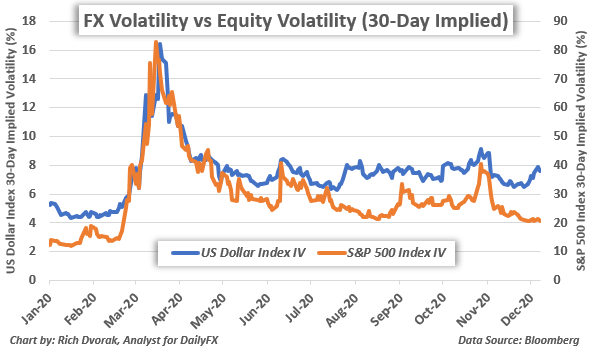
That all said, the acceleration in FX implied volatility readings over recent trading sessions is notable. The 30-day implied volatility reading on the US Dollar Index has climbed to levels last seen in the midst of the presidential election. If expected FX volatility continues to churn higher, there could be potential for the S&P 500-derived VIX Index to follow in lockstep as it has historically. This could weigh negatively on trader risk appetite, which might send the safe-haven US Dollar higher.
Disclosure: See the full disclosure for DailyFX here.


