
US Dollar Steadies After Disappointing November US Jobs Report
US DOLLAR’S TOUGH WEEK
The US Dollar (via the DXY Index) ran to fresh two-year lows during the first trading week of November, a clear sign that significant technical damage has occurred. While the greenback initially sold off on the disappointing US labor market data, the bleak numbers boosted speculation that US Congressional leaders will finally agree to another tranche of fiscal stimulus.
Rising US Treasury yields – the 10-year appears to be on track to end the week north of 96-bps – may be giving the US Dollar a lifeline as it scrambles to find support. The past two trading days produce long wicks on the daily charts – often a sign of exhausted selling – but, as the grim saying goes, “even dead cats bounce.”
Short-term strength in the US Dollar may simply be presenting a better opportunity to sell once again. After all, with promising coronavirus vaccine development news, the prospect of fresh fiscal stimulus (increasing US deficits), and prolonged low interest rates (per the Federal Reserve, through 2023), US real yields remain susceptible to falling again – a reaction that has plagued the US Dollar this year.
DXY PRICE INDEX TECHNICAL ANALYSIS: WEEKLY CHART (AUGUST 2011 TO DECEMBER 2020) (CHART 1)
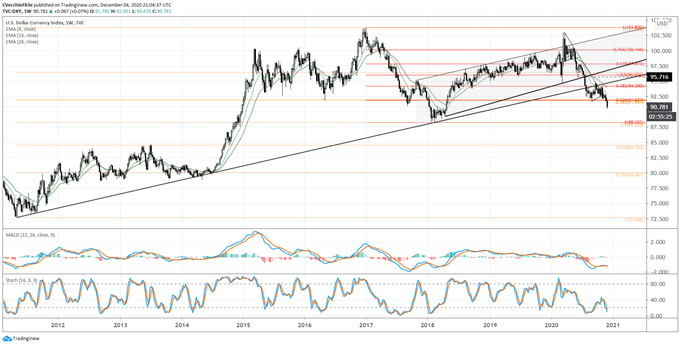
Even with the daily candlesticks showing long wicks, the damage is done: concurrent with the drop to fresh yearly lows, the DXY Index has also broken down through the 23.6% Fibonacci retracement of the 2018 low/2020 high range and the 38.2% Fibonacci retracement of the 2011 low/2020 high range at 91.93. There are few areas of support in clear range. The next major Fibonacci retracements arrive exactly at the 2018 low.
Bearish momentum remains strong on the weekly timeframe. Weekly MACD is trending lower below its signal line and Slow Stochastics are trending lower in oversold territory. The DXY Index continues to trade below its weekly 4-, 13-, and 26-EMA envelope – the monthly, quarterly, and half-year moving averages. It still holds that the weekly charts are suggesting that the path of least resistance remains to the downside for the DXY Index.
DXY PRICE INDEX TECHNICAL ANALYSIS: DAILY CHART (DECEMBER 2019 TO DECEMBER 2020) (CHART 2)
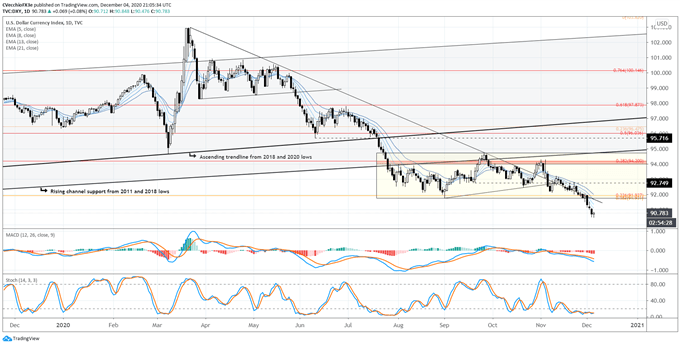
As noted, while the past two trading days produce long wicks on the daily charts – often a sign of exhausted selling – it can’t be denied that significant technical damage occurred to the DXY Index this week. Accordingly, the outlook updated on December 2 remains valid: “bearish momentum continues to set the tone, with the DXY Index holding below the daily 5-, 8-, 13-, and 21-EMA envelope, which is in bearish sequential order. Daily MACD is trending below its signal line, while Slow Stochastics are holding in oversold territory…a simple doubling of the range following the loss of 91.75 suggests that the DXY Index could target as low as 88.75 – not too far from the 2018 low at 88.25.”
IG CLIENT SENTIMENT INDEX: EUR/USD RATE FORECAST (DECEMBER 4, 2020) (CHART 3)
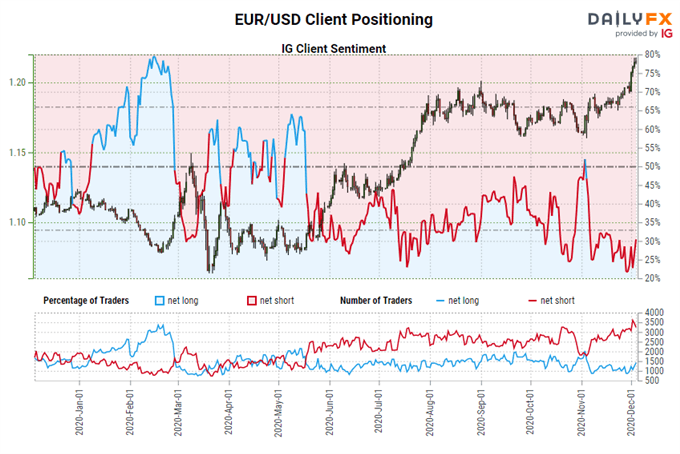
EUR/USD: Retail trader data shows 30.45% of traders are net-long with the ratio of traders short to long at 2.28 to 1. The number of traders net-long is 6.20% higher than yesterday and 42.24% higher from last week, while the number of traders net-short is 1.56% lower than yesterday and 2.05% higher from last week.
We typically take a contrarian view to crowd sentiment, and the fact traders are net-short suggests EUR/USD prices may continue to rise.
Yet traders are less net-short than yesterday and compared with last week. Recent changes in sentiment warn that the current EUR/USD price trend may soon reverse lower despite the fact traders remain net-short.


