
US Dollar Price Action Setups: EUR/USD, USD/CAD, GBP/USD, USD/JPY
It’s been an eventful Q2 and the US Dollar bullish trend is now more than a year old. The Greenback found support at the 90 psychological level in DXY last year and this showed in both January/February and May/June. Last year’s Q3 saw prices in the USD move towards short-term resistance, with a breakout showing in September just after the Fed started to forecast actual rate hikes for 2022.
At the time, the SEP highlighted just one rate hike in 2022. Inflation at the time was already running over 5% after CPI had printed at 5.3% for the month of August. But, this simple move of highlighting a single rate hike in 2022 was enough to show markets that the Fed would, in fact, respond at some point.
It just took much, much longer than many had anticipated.
The bank finally started hiking in March. Inflation had pushed up to 7.9% by then and the 25 basis point hike at that meeting has done little to settle the trend of higher prices, with May CPI coming in at 8.6%. But – the bank has continued to talk up the potential for more hikes and the past two rate decisions have brought in moves of 50 and 75 basis points respectively, indicating that the Fed is ready to take some tough medicine here in trying to deal with inflation.
Europe, on the other hand, seems to be a bit further behind a similar trend. Inflation in Europe has crossed 8% and likely, there will be more gains there. At this point, the ECB has mentioned a 25 basis point hike in July followed by another possible hike in September. But – will this get the job done? Or – will the ECB find itself in a similar spot as the Fed, hurriedly trying to play catch up with a policy in the effort of stemming widespread and persistent inflation?
This will be an issue for Q3 but the answer to this question is key for the trajectory of the US Dollar, which has enjoyed a strong ride over the past year on the back of the FOMC sticking out as the most-hawkish Central Bank in the developed world and given the pace of inflation elsewhere, this may not last.
US Dollar
Taking a longer-term look at the USD and the currency remains perched atop a big zone of resistance. The level of 103.82 was the swing-high in 2017 and more recently, it’s been helpful as a spot of short-term support. But, also pitching in is a Fibonacci retracement at 101.80 which helped to find support in late May.
Notable, however, is the upper wick on last week’s candle, indicating a reversal. And this happened right after the FOMC released its rate decision indicating a 75 basis point hike. And when a market does not move higher on seemingly good news, look out below, as something else may be brewing for what’s around the next corner.
US Dollar Weekly Price Chart
(Click on image to enlarge)
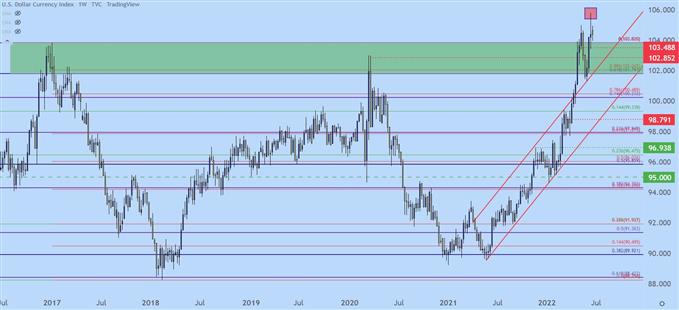
Chart prepared by James Stanley; USD, DXY on Tradingview
EUR/USD
The second quarter has been a rough outing for the Euro. The big spot to pay attention to in EUR/USD is the area around the current 19-year-low of 1.0340. This was set in 2017 just before the pair mounted a 2,000 pip incline that ran into the next year.
More recently, as USD strength started to come online the last Q2, EUR/USD started a down-trend that hasn’t really stopped or even slowed down by all that much – prices have just continued to fall.
So when the price action was hurdling lower in early May with that 1.0340 support in sight, the calls for parity quickly populated newsfeeds as banks started looking for that elusive print at 1.0000, which hasn’t happened since 2002. And it didn’t happen here either, as support showed up about 12 pips higher in early May.
And then again – just after the FOMC rate hike, as the USD was spiking up to its own 20-year-high, EUR/USD pushed down to support and, again, set a higher low.
This isn’t necessarily forecasting a full-fledged reversal. But, it might have enough in it to allow for a bit of a pullback. And if we do see the fundamental tides shift in Q3, maybe something more can develop. But, generally speaking, I do expect that support to give way eventually. We just may need a deeper pullback move to wash out some of the trailed stops on short positions that have been riding this trend that’s more than a year old now.
EUR/USD Weekly Price Chart
(Click on image to enlarge)

Chart prepared by James Stanley; EURUSD on Tradingview
GBP/USD
It was an even more painful quarter for GBP as the Euro has out-performed the British Pound in Q2, which can be witnessed by the breakout in EUR/GBP.
But, to be sure, the Bank of England will be dealing with a similar issue as the ECB with inflation expected to continue climbing there. In the U.K., the BoE has been up-front about its expectations which include the possibility of recession as inflation climbs above 10% later this summer. The difference, however, is that the BoE has already started the process of hiking rates.
In GBP/USD, the pair crossed a big level last week at 1.2000. A strong pullback developed shortly after, and there may be a bit more room for that theme to work, with possible resistance in the 1.2452-1.2500 area on the chart. If that doesn’t hold, there’s another spot of prior support/resistance overhead, plotted around the 1.2650 area on the chart.
GBP/USD Weekly Price Chart
(Click on image to enlarge)
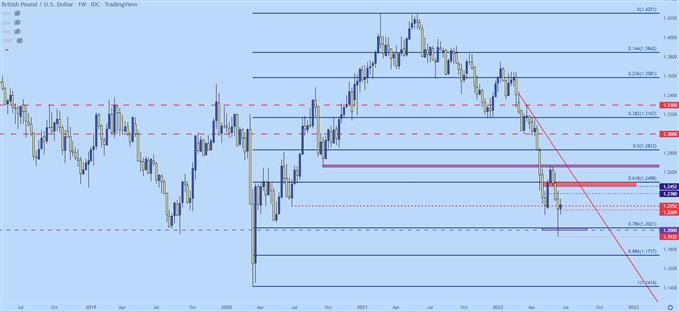
Chart prepared by James Stanley; GBPUSD on Tradingview
USD/CAD
The big question for Q3 in USD/CAD is whether the pair can cross 1.3000. To be sure, there have been tests and there’s a resistance zone running from 1.2950-1.3000 that’s basically been tested since last August. To date, none of those tests have led to a lasting break although last week was looking promising until prices pulled back for support at 1.2950.
This keeps the door open for bullish breakout potential going into Q3, with the possibility of the pair finally breaching above and leaving the 1.3000 level behind (at least for a bit).
USD/CAD Weekly Chart
(Click on image to enlarge)
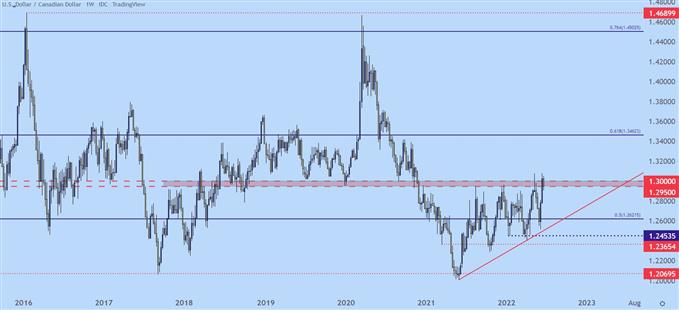
Chart prepared by James Stanley; USDCAD on Tradingview
USD/JPY
How long can the BoJ keep up their heavy pace of accommodation? That’s the big question for Q3 and it likely won’t be going away anytime soon. Last week heard the bank keep the same ‘closely watching’ verbiage in their statement regarding Yen-weakness and markets saw this as a clear sign to sell the currency again, which led to a fresh 24-year high in USD/JPY.
But, the idea of this theme lasting for another full quarter, especially as most other global central banks grow more hawkish, seems a bit of a stretch.
That’s not a current concern, however, and the USD/JPY pair remains very near those newly-established 24-year highs, and that prior spot of resistance around the 135.00 psychological level now becomes potential support.
USD/JPY Four-hour Price Chart
(Click on image to enlarge)
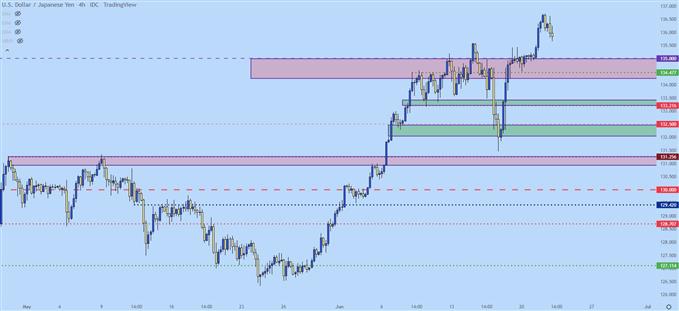
Chart prepared by James Stanley; USDJPY on Tradingview
Disclosure: See the full disclosure for DailyFX here.


