
US Dollar Price Action Into 2021: EUR/USD, GBP/USD, USD/JPY
With now less than two weeks to go until the 2021 open, markets appear primed for continued volatility in the New Year as a number of pertinent drivers remain. Probably one of the more noticeable FX trends of 2020 has been USD-weakness. The US currency put in a run of strength as the pandemic was getting priced-in during late-February and early-March trade. But, that didn’t last for long as a very busy FOMC helped to soothe investors’ fears, with US equities putting in a significant bounce from the March 23rd lows.
And for the rest of the year, risk assets remained strong and supported as the US Dollar just continued to fall to fresh lows. The big question for FX markets ahead of the 2021 open is whether the US Dollar has more room to go. We’ve just released updated forecasts for Q1 of 2021, and I authored the US Dollar technical portion of that report with Mr. John Kicklighter covering the fundamentals.
Of note from the longer-term chart below, the US Dollar completed an evening star formation with the November close. Such formations are often followed with the aim of bearish continuation after the reversal showed within the formation. It just so happens that this evening star also printed on the underside of a prior bullish trendline (inflection highlighted in green).
US DOLLAR MONTHLY PRICE CHART
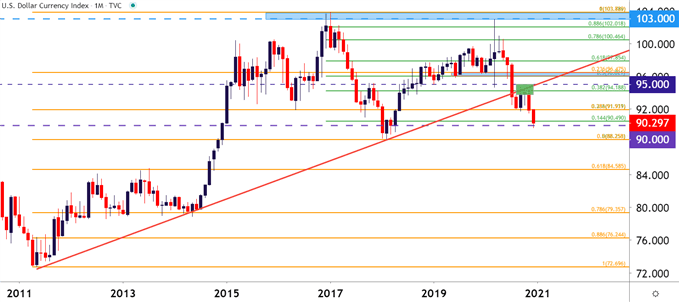
Chart prepared by James Stanley; USD, DXY on Tradingview
On the above chart, there’s a big area of possible support lurking below, around the 88.26 price on DXY. This is the 50% marker of the 2011-2017 major move, and when it came into play briefly in 2018, it caught the low and now functions as the two-year-low in DXY.
It appears the big key to whether or not this comes into play is the Federal Reserve and how they respond to incoming inflation data. One of the big pivots from 2020 was the bank moving to target ‘average inflation,’ which should give the FOMC a bit of subjectivity to rate policy should inflation begin to increase.
With the end-of-year lurking traders should be cautious of short-squeeze scenarios in the USD, as the currency has been exhibiting signs of support over the past week as sellers may rightfully be exhausted. The 90.00 psychological level in DXY could be especially stubborn at this late stage of the game, and the pair may need a bit of rip to clear out some stops before sellers might be able to drive down towards that 88.26 spot on the chart.
US DOLLAR DAILY PRICE CHART: SELLER STALL AT 90 BIG FIG
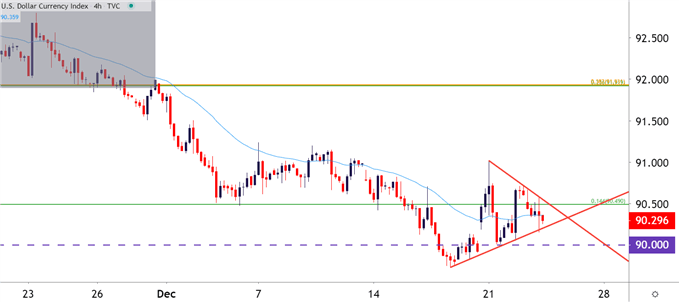
Chart prepared by James Stanley; USD, DXY on Tradingview
EUR/USD REMAINS PERCHED NEAR TWO-YEAR-HIGHS
It was a surprisingly strong year for the Euro, even with the ECB continuing to increase stimulus amidst an ongoing pandemic. In EUR/USD, that Euro strength meshed with a really weak US Dollar, and, at this point, the currency pair remains perched very near fresh two-year-highs that were set just last week.
At this point, the pair appears to be trying to hold higher-low support at an area of prior resistance: And this is the same resistance zone that marked the neckline of an inverse head and shoulders pattern before last week’s FOMC-fueled breakout.
This zone already caught a support inflection earlier this week. This support zone spans from 1.2134 up to 1.2167, each of which derive from longer-term Fibonacci studies. A hold of support in this zone keeps the door open for topside strategies, but with the caveat of comfort around USD given the scenario looked at above (and which we’ll discuss further a little below).
EUR/USD FOUR-HOUR PRICE CHART
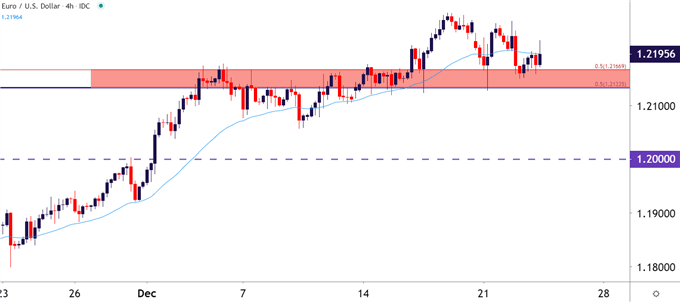
Chart prepared by James Stanley; EUR/USD on Tradingview
Given the potential for a short-squeeze in the US Dollar going into year-end, and there could be some similar possibility of a trap setting up on the long side of EUR/USD.
While the current support zone has some longer-term connotations and did an impressive job of helping to set resistance (and the neckline of that inverse head and shoulders pattern); we never saw EUR/USD test the 1.2000 psychological level for support after the December 1st breakout. This level gave a strong dose of resistance in early-September; and given that we’ve already seen some support show in the current zone, the door could be open to a deeper bearish run in the pair with eyes towards that 1.2000 spot for subordinated support.
EUR/USD WEEKLY PRICE CHART:
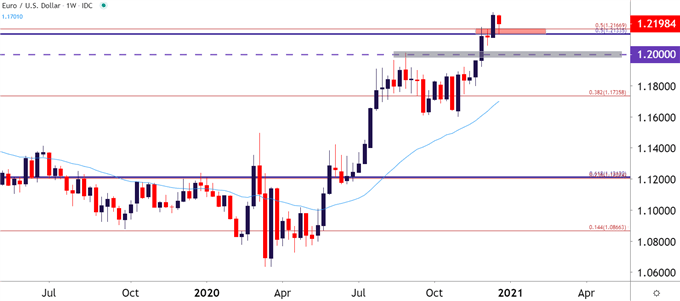
Chart prepared by James Stanley; EUR/USD on Tradingview
GBP/USD CABLE CHAOS CONTINUES ON BREXIT POSITIVITY
For those that are looking for some volatility through the holidays, GBP/USD may have some volatility to offer. As of this writing, it appears as though a Brexit deal is set. But, for anyone that’s not knew to Brexit, there should be a hefty dose of cynicism as there’s been numerous twists and turns in the Brexit saga over the past four years.
In GBP/USD, hope springs eternal as the pair tests above the 1.3500 zone. This has been a problematic area for GBP/USD as we’ve had but a handful of daily closes above this level over the past couple of years.
GBP/USD DAILY PRICE CHART: CABLE ENCOUNTERS THE BIG FIG
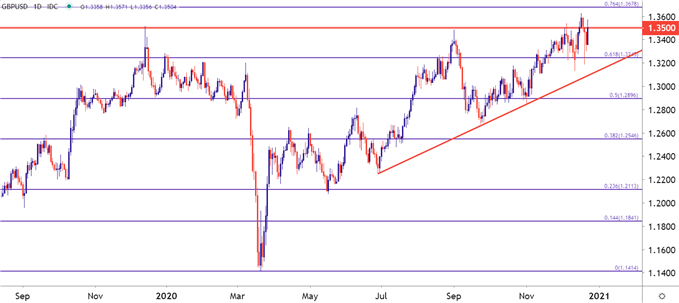
Chart prepared by James Stanley; GBP/USD on Tradingview
For traders seeking volatility, the shorter-term chart may be more attractive. On the two-hour chart below, notice the expanding price action as mean reversion has continued to show. Should Brexit headlines continue to populate through news flow, this can keep the currency and the pair on the move.
GBP/USD TWO-HOUR PRICE CHART
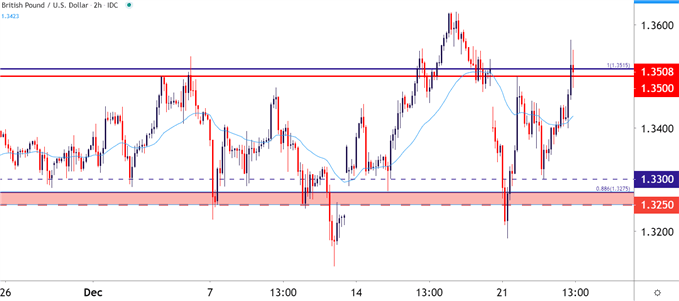
Chart prepared by James Stanley; GBP/USD on Tradingview
USD/JPY: SOMETHING’S GOING TO GIVE
This is my top trade idea for next year, looking for USD/JPY to put in a deeper breakdown as price action has built in a string of support around the 103.11 Fibonacci level. The rationale here is that the bearish backdrop in USD/JPY could work with both risk-on and off themes; and without Shinzo Abe at the helm and with the BoJ still very stretched on the monetary front – how much room does the BoJ have to soften or weaken the Yen? I don’t anticipate that the BoJ will be able to keep up with the Fed next year, and that speaks to the short-side of the pair. To get my top trade idea for next year, the link below can set that up:
The technical backdrop meshes with that as the lower-highs post-March, combined with the horizontal support over the past couple of months at the Fibonacci level; produces a backdrop similar to a descending triangle. Such formations will often be approached with the aim of breakdown, looking for the horizontal support to, eventually, give way to the surging supply being offered by sellers with lower-highs bringing on lower-lows.
USD/JPY WEEKLY PRICE CHART
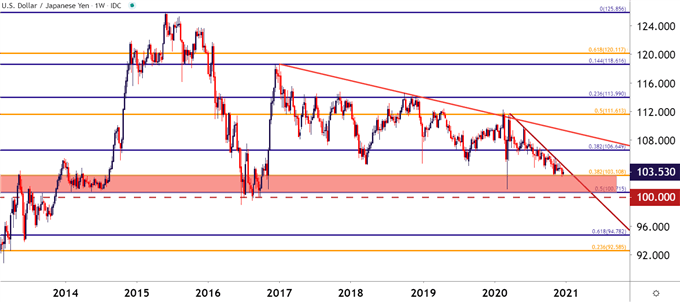
Chart prepared by James Stanley; USD/JPY on Tradingview
US STOCKS IN 2021
I’ve already shared my two cents on the matter in last week’s webinar, which you’re certainly welcome to. I remain bullish for next year although I’m of the believe that we’ll need a bit of a pullback in the early-portion of the year, perhaps Q1 but I’d prefer to span that expectation into H1.
To hear more of my views for what’s on the way in 2021, please check out US Dollar Price Action into 2021: EUR/USD, USD/JPY.
And, lastly, I would just like to take this opportunity to say thank you to everyone that’s read or engaged with DailyFX over the past year. It’s been a tumultuous year, to be sure, but hope and optimism populate the horizon for better days ahead. Your readership and your time are incredibly important, and they will never be taken for granted. Thank you.
Disclosure: See the full disclosure for DailyFX here.


