
US Dollar Outlook: USD Price Volatility & Implied Trading Ranges
Expected currency volatility continues to show signs of receding from recent levels with 1-week implied volatility measures across major forex pairs sliding from readings taken in last week’s US Dollar Price Volatility Report. This is also reflected by the relatively lower 1-week implied volatility readings for the selected USD pairs when compared to their respective average readings over the last 20 trading days and 12-month distributions. Options-implied trading ranges are calculated using 1-standard deviation (i.e. 68% statistical probability price action is contained within the implied trading range over the specified time frame).
US DOLLAR IMPLIED VOLATILITY & TRADING RANGES (1-WEEK)
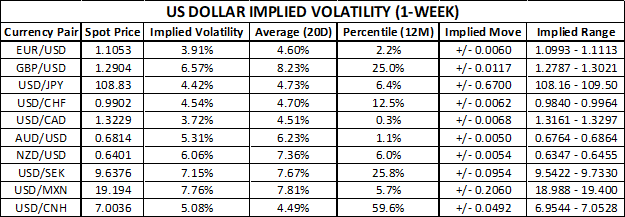
That said, GBP/USD is expected to be the most volatile G7 currency pair while USD/SEK is expected to be the most volatile G10 currency pair with 1-week implied volatility readings of 6.57% and 7.15% respectively. USD/CAD 1-week implied volatility is interestingly low considering recent Canadian jobs data and upcoming speeches from BOC Governor Poloz, which puts the loonie at risk relative to its US Dollar counterpart. AUD/USD 1-week implied volatility also seems peculiarly depressed considering a dismal Australian employment and Chinese economic data, which may motivate another RBA rate cut.
CHART OF US DOLLAR INDEX REALIZED VS IMPLIED VOLATILITY
(Click on image to enlarge)
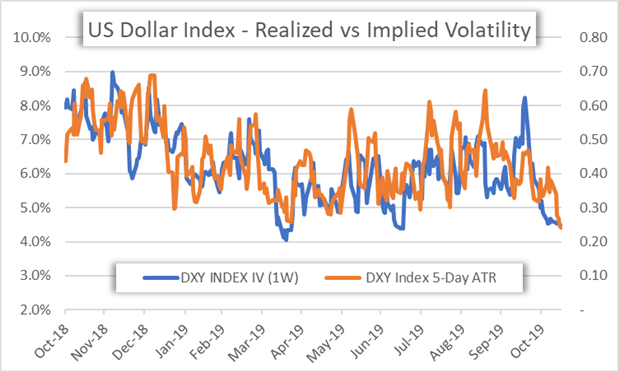
A lack of currency volatility, while generally positive for risk appetite, could weigh negatively on broader USD price action. This concept can be largely attributed to the US Dollar’s posturing as a safe haven currency. When implied volatility and realized volatility are on the rise it typically indicates an increase in perceived risk or uncertainty (and vise-versa). With risk appetite plentiful, however, US Dollar selling pressure might soon resume due to waning haven demand.
FED BALANCE SHEET ON PACE TO TOP $4.2 TRILLION BY YEAR-END
(Click on image to enlarge)
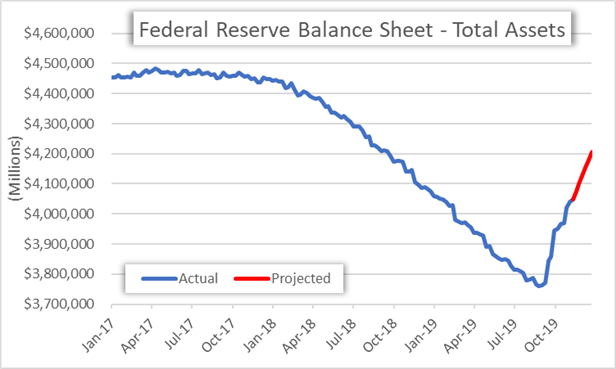
Another headwind faced by the US Dollar is the near-vertical explosion in the size of the Federal Reserve’s balance sheet. The FOMC has increased the total assets held by the central bank by a whopping $288 billion since the beginning of September. In short, this increases the supply of dollars circulating in the financial system and has serious potential to keep exerting downward pressure on USD price action.
FOMC INTEREST RATE CUT PROBABILITIES BACK ON THE RISE
(Click on image to enlarge)
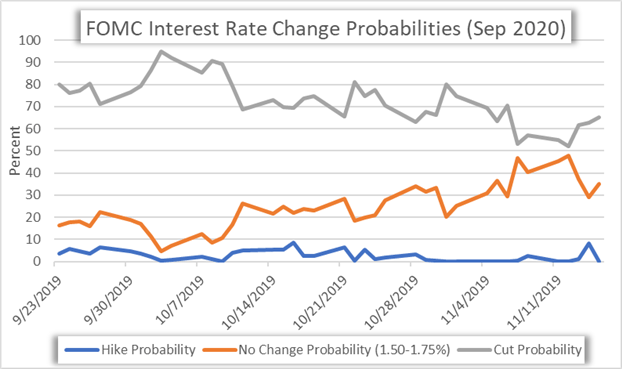
The latest overnight swaps pricing for the Federal Reserve’s monetary policy update scheduled for its September 2020 meeting seems to be repricing FOMC rate cuts. Aside from US-China trade talk uncertainty starting to resurface as the two sides struggle to finalize a phase one trade agreement, US economic data is showing signs of deteriorating further. Most recently, US retail sales data disappointed traders and could partly explain the recent rebound in Fed rate cut expectations. The probability that the FOMC will deliver another interest rate cut by its September 2020 meeting has climbed from a low of 52.2% earlier this week to the most recent reading of 65.0%.


