
- The US Dollar Index could find initial support at the three-year low of $96.38.
- Short-term price momentum is weaker as DXY holds below the nine-day EMA.
- The immediate resistance appears at nine-day EMA of 97.83.
The US Dollar Index (DXY), which measures the value of the US Dollar (USD) against six major currencies, is remaining steady after three days of losses and trading around 97.40 during the early European hours on Wednesday.
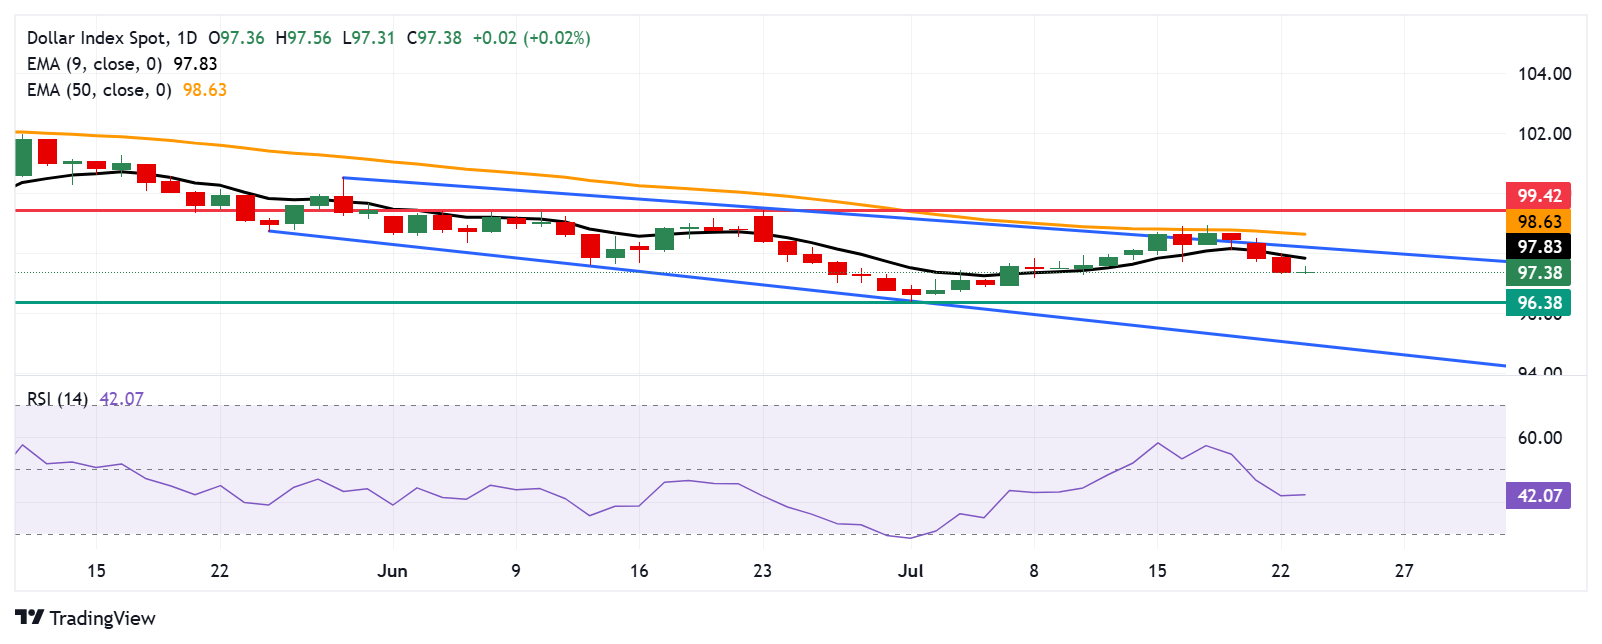
The technical analysis of the daily chart shows the dollar index moving downwards within a descending channel pattern, suggesting a persistent bearish bias. Additionally, the 14-day Relative Strength Index (RSI) is remaining below the 50 level, strengthening bearish bias. The short-term price momentum is weaker as the DXY is positioned below the nine-day Exponential Moving Average (EMA).
On the downside, the DXY could target the three-year low at $96.38, recorded on July 1. A break below this level could reinforce the bearish bias and put downward pressure on the dollar index to approach the lower boundary of the descending channel around 95.00.
The US Dollar Index may test the primary barrier at nine-day EMA of 97.83, followed by the descending channel’s upper boundary around $98.30. A successful break above this crucial resistance zone would improve the short-term price momentum and support the DXY to test the 50-day EMA at 98.63. Further advances would strengthen the medium-term price momentum and prompt the dollar index to target the two-month high at $99.42, which was reached on June 23.
US Dollar Index: Daily Chart
(Click on image to enlarge)
US Dollar PRICE Today
The table below shows the percentage change of US Dollar (USD) against listed major currencies today. US Dollar was the strongest against the Euro.
| USD | EUR | GBP | JPY | CAD | AUD | NZD | CHF | |
|---|---|---|---|---|---|---|---|---|
| USD | 0.10% | -0.09% | 0.06% | -0.11% | -0.39% | -0.70% | -0.10% | |
| EUR | -0.10% | -0.19% | -0.03% | -0.20% | -0.51% | -0.79% | -0.20% | |
| GBP | 0.09% | 0.19% | 0.18% | -0.01% | -0.33% | -0.60% | 0.04% | |
| JPY | -0.06% | 0.03% | -0.18% | -0.17% | -0.42% | -0.65% | -0.15% | |
| CAD | 0.11% | 0.20% | 0.01% | 0.17% | -0.26% | -0.37% | 0.04% | |
| AUD | 0.39% | 0.51% | 0.33% | 0.42% | 0.26% | -0.27% | 0.35% | |
| NZD | 0.70% | 0.79% | 0.60% | 0.65% | 0.37% | 0.27% | 0.65% | |
| CHF | 0.10% | 0.20% | -0.04% | 0.15% | -0.04% | -0.35% | -0.65% |
The heat map shows percentage changes of major currencies against each other. The base currency is picked from the left column, while the quote currency is picked from the top row. For example, if you pick the US Dollar from the left column and move along the horizontal line to the Japanese Yen, the percentage change displayed in the box will represent USD (base)/JPY (quote).
More By This Author:
Australian Dollar Continues To Climb On The Back Of Improving Market SentimentGold Price Hovers Near $3,400, Steadies Due To Trade-Related Uncertainties
Australian Dollar Declines As US Dollar Maintains Position Amid Persistent Aversion


Comments
Log in or sign up to join the conversation.