
US Dollar Extends Rally As Global PMI Data Fans Volatility
The Greenback is gaining ground during early Wednesday trade as the US Dollar builds upon its bullish reversal attempt off two-year lows. USD price action is strengthening in the wake of global PMI data just released by IHS Markit, which revealed that business activity across several advanced economies is slumping. Risk aversion in response to the disappointing PMI figures looks to be bidding up the US Dollar due to its posturing as a top safe-haven currency.
IHS MARKIT COMPOSITE PMI DATA - UNITED STATES VS EUROZONE
(Click on image to enlarge)

According to the DailyFX Economic Calendar, flash US PMI data was little changed month-over-month. The US manufacturing sector improved marginally from 53.1 to 53.5, but the more important services sector component dropped from 55.0 to 54.6 for September.
On a relative basis, US economic activity held up better than its EU counterpart with Eurozone PMI data showing a sharper decline in its composite index to 50.1 from 51.9 reported previously. This divergence between EU and US PMI data, which was first identified right after last month’s PMI data release, stands to fuel broader US Dollar strength.
US DOLLAR INDEX PRICE CHART: DAILY TIME FRAME (20 MAY TO 23 SEP 2020)
(Click on image to enlarge)
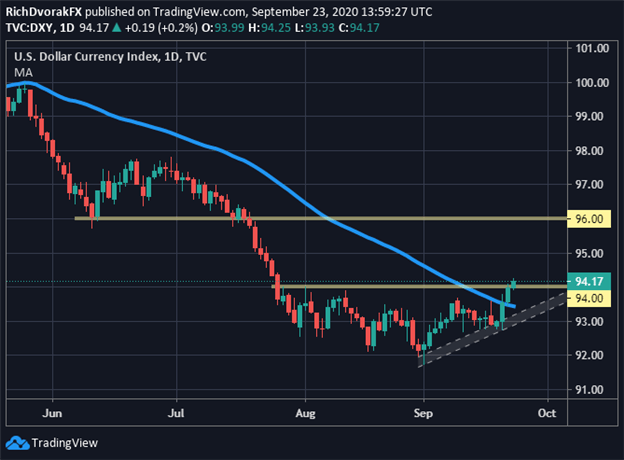
Chart created by @RichDvorakFX with TradingView
The US Dollar Index jumping above the 94.00-price level likely serves as an unnerving technical development for USD bears. This could validate a neckline break of the inverse head and shoulder reversal pattern, which follows the US Dollar reclaiming its 50-day moving average.
From a fundamental perspective, rising market volatility stands out as a primary driver steering USD price action higher. Mounting risk aversion could exacerbate the resurgence of US Dollar strength - particularly if a short squeeze ensues with Euro bulls unwinding their long EUR/USD positions.
EUR/USD PRICE CHART: DAILY TIME FRAME (12 JUN TO 23 SEP 2020)
(Click on image to enlarge)
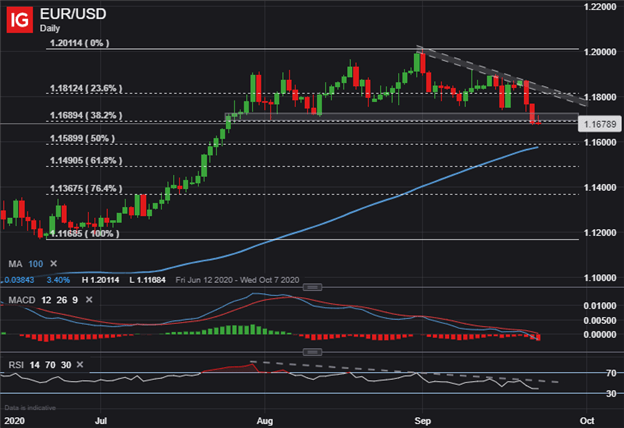
That said, the broader US Dollar shows potential to continue climbing with spot EUR/USD price action breaching its critical support zone around the 1.1700-mark. EUR/USD printing lower lows brings to focus its 100-day moving average near the 1.1600-handle as a possible downside objective for US Dollar bulls. This area of technical confluence is also underpinned by its mid-point retracement of the rally from 1.1200 to 1.2000.


