
UK May Survives, Aussie Economy From Bad To Worse

The State of Affairs in Financial Markets — Jan 17
The flourishing risk in financial markets extends as the ES founds a new leg up, led by financials after banking giants the likes of Bank of America/Merrill Lynch or Goldman Sachs reported upbeat earnings even as volatility in its FICC business is an undesirable event. In the currency market, the short-term low vol means low-yielding carry trades more appealing, as reflected by the falls in the EUR or JPY against the Greenback. However, be no complacent as the macro risk profile structure originated thru Dec still casts a shadow.
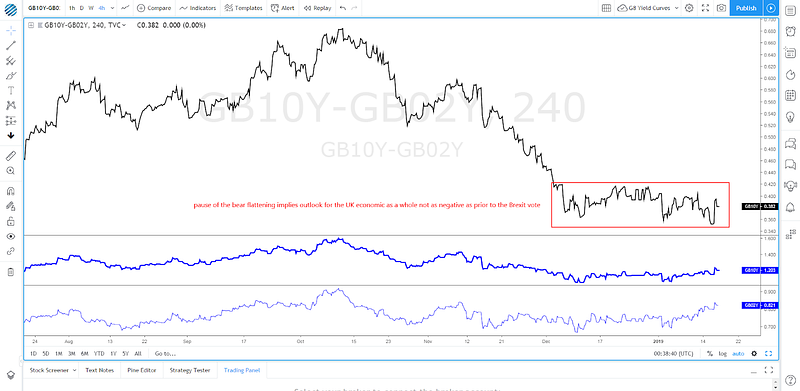
Even as UK PM’s May managed to survive the no-confidence motion by Labour’s Jeremy Corbyn on Wednesday, backed by the full extent of her conservative party and the DUP, the muted volatility in the Sterling reminded us that this was the main scenario being discounted. Nonetheless, the bullish divergence in the UK vs US bond yield spreads, the pause in the flattening of the UK yield curve or the fact that we saw premiums to own GBP Calls in a temporality of 1-month above Puts*, suggesting that the risks towards the Sterling keep building towards further upside price discovery auctions.
*Update: In today’s 25-delta RR, Puts trade above Calls for the first time this week. Caution is warranted as option traders price in potential setback.
In what has arguably become the biggest mess in European history, neck to neck with the Greek debt crisis drama, UK’s PM next step has been to invite the opposition to begin negotiations. Everyone and his dogs is asking the same question. What’s next in the Brexit saga? What is May’s plan B?
In a nutshell, the clarity or lack thereof after the humiliating Brexit vote defeat takes us into the following stage: Extension of article 50 to delay the UK’s departure of the EU, softer Brexit or no Brexit. One of the options that appears to have been killed is the hard Brexit one as anyway you slice it, most seem to perceive that a hard Brexit and back to WTO rules would be catastrophic for the economy. As illustrated above, the UK yield curve or options pricing foretells us hard Brexit is largely priced out.
Morgan Stanley Research Team has put together a scenario tree with the different possibilities that exist after the Brexit vote defeat, noting that more clarity is expected by early February.
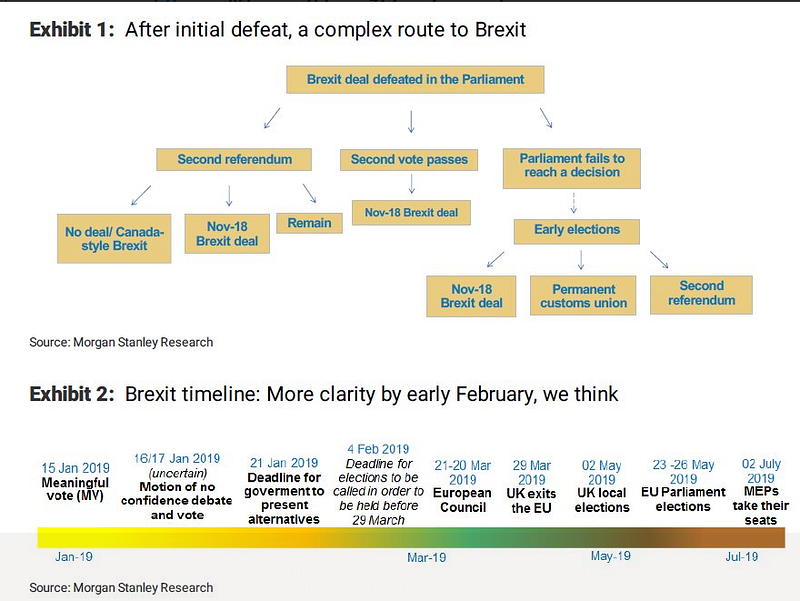
Source: Morgan Stanley
Moving into the European shared-currency, with a VIX back sub 20.00 this week — first time in a month — attracting short-term carry trade flows via EUR-funding and EU economic fundamentals in a state of disarray even, it’s been a real struggle to see any motion in the world’s most traded pair. ECB’s Draghi intervention in the European Parliament on Tuesday, highlighting the increasing downside risk that exist based on the weakening economic trend, harbingers theCB may be laying the grown for an adjustment in its economic projections and the market could be taking notice of it.
In the US, as the agonizing government shutdown extends into its 4th wee with no end in sight, the latest economic data justifies no celebrations either. This week’s Empire State Manuf was a reminder of the headwinds being faced in the manufacturing sector following the nationwide US ISM upset last month. The US PPI index also came worse-than-expected this week, and the pyrrhic pick up in the NAHB housing market to 58 vs a peak of 75 last year, is far from a meaningful positive to latch on.
Besides, we also learnt that the Beige Book, which is a summary of commentaries by Fed districts on current economic conditions, came surprisingly upbeat, which I personally find a lagging and out of whack with the reality to play out in Q1, that is, much slower growth courtesy of the slowdown in global economic activity taking its toll but most importantly, on the US government shutdown, which is expected to weaken domestic growth considerably during Q1. James Knightley Chief International Economist at ING, notes that risks for growth are moving to the downside quite rapidly as the longest shutdown in US history extends.
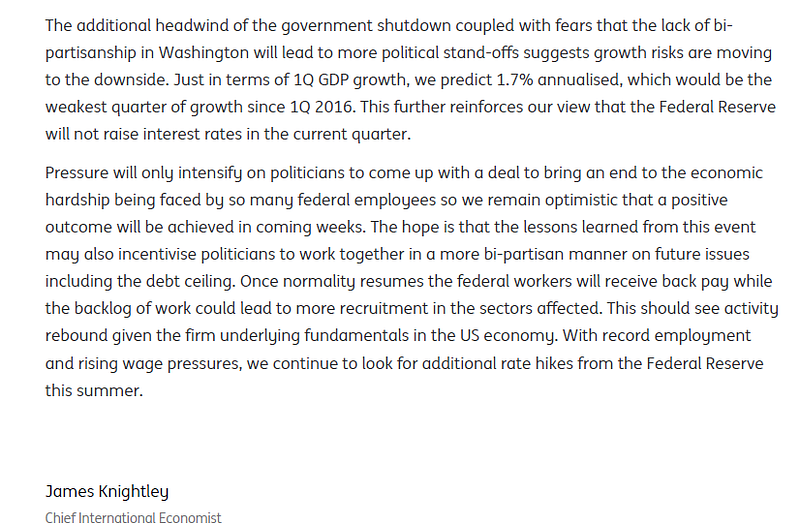
Source: ING
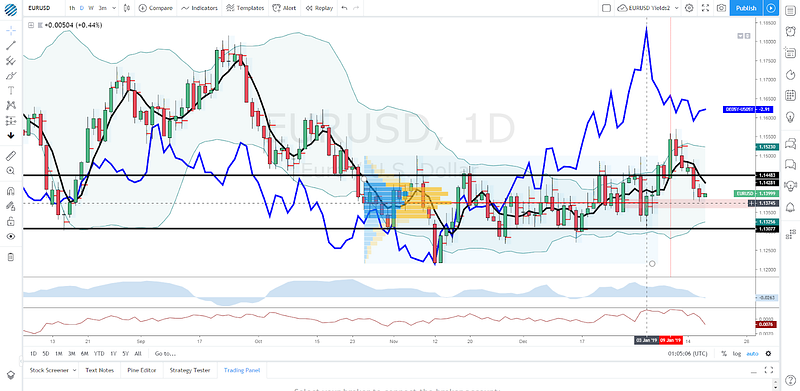
Where do this leave us in the EUR/USD? From a day-to-day price change standpoint, and as I make the case in my latest report The US Dollar Enters A New Bearish Phase Near-Term , grounds can be found to stay constructive in the EUR if one analyzes its market structure, volumes and YS valuation. In other words, if you remain short the pair, it should get tougher from here.
Ever since the price action printed in 2019, the structurally bullish dynamics in the EUR/USD have improved by finally finding a resolution away from its multi-month saturated range, and so far, what what the correction back down has achieved is, all else equal, offer a fairly attractive discounting price to engage in a potential buyside action campaign in what some may consider, as me, a low risk entry for at least a retest of 1.1450.
This view is predicated on the basis that the German vs US yield spread, from a macro perspective, continues to exhibit a bullish divergence. Besides, the push up through 1.15 validating a new cycle up came amid an impulsive move with a greater extension in magnitude relative to the prior extension up. What’s more, the price is now retesting the area with the highest accumulation of volume (POC) during the Nov-Dec confined range.
A macro story worth highlighting, which I particularly find of great interest to AUD traders, is the news that US prosecutors are pursuing a criminal case against Huawei, according to the WSJ. According to the report, the US finds a credible case with indictment grounds “for allegedly stealing trade secrets from U.S. business partners, including the technology for a robotic device called “Tappy” that T-Mobile US used to test smartphones, according to people familiar with the matter.”
If you own long AUD exposure, as I do via EUR/AUD shorts from last week, you should be aware that this is not going to help the US-Sino relationship, at its lowest trust point in recent history. The news, in its own right, carries enough credence to stay ultra vigilant without assuming that a more comprehensible trade deal is done and dusted.
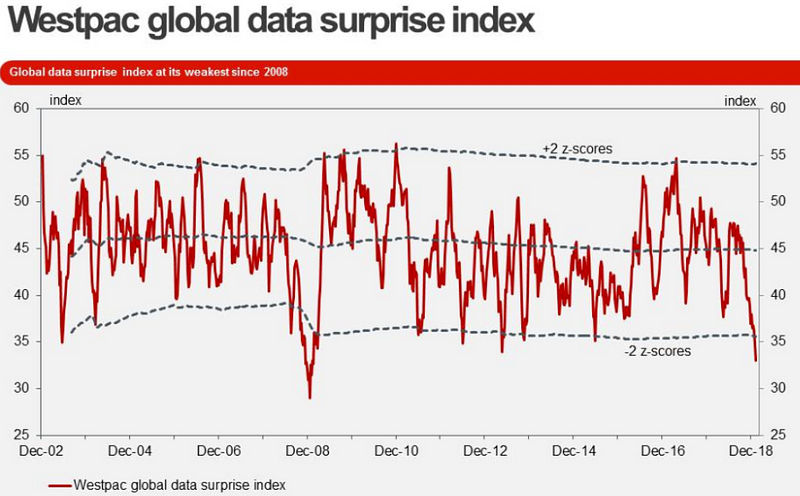
Still, when you consider the major sell-off in US asset through Dec, the slowdown in Chinese economic activity, and the strength in the Yuan, both sides should find enough reasons for their own benefit to hash out a deal. Interestingly, in the last 24h, even as the Aussie vs US yield spread retests its highest levels since August ’18, looks like fundamentals are back weighing on the Aussie after a disastrous Westpac consumer confidence read. Even worse, Westpac reported their global data surprise index at the lowest since 2008.
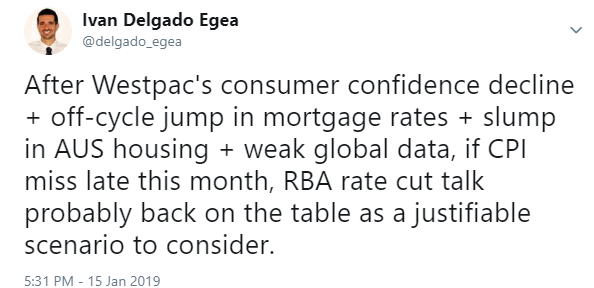
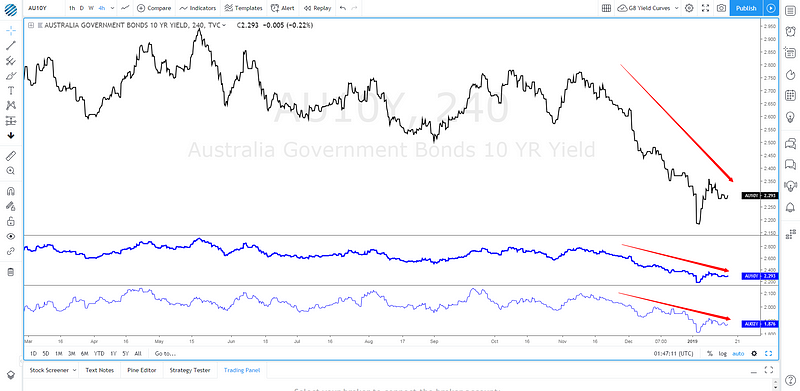
Here is my Twitter take on the state of affairs, followed by an alarming bull flattening of the Australian yield curve, which essentially tells us risk of an RBA rate cut are mounting.
The Aussie has recently been galvanized into bullish action via the constructive risk profile, EMs (including CNH) cheering the outlook for a more protracted US-Sino trade deal that leaves behind tariffs and the major injections of liquidity ahead of the Chinese Lunar New Year (Feb 4–10) by the PBOC. However, there seems to be some much needed ‘catch down’ to do in alignment with weaker fundamentals in a country (Australia) that runs clear risks of a further slump in its housing market and overall economic activity.
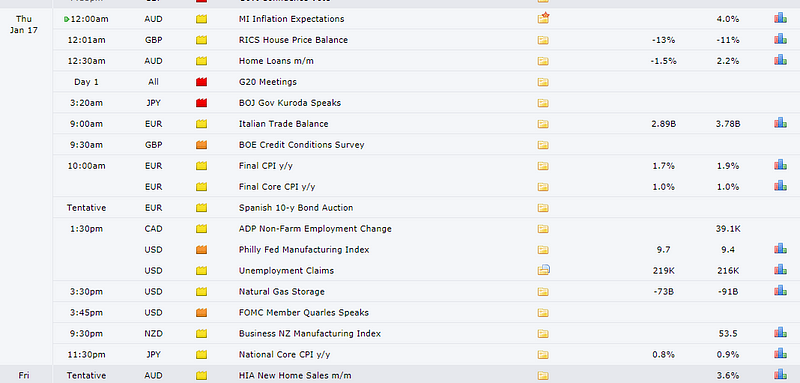
You can find an Australian economic calendar heatmap to judge by yourself.

Source: Global Prime, Forex Factory
Economic Calendar Next 24h
Risk Model: US Fixed Income First Rolling Over
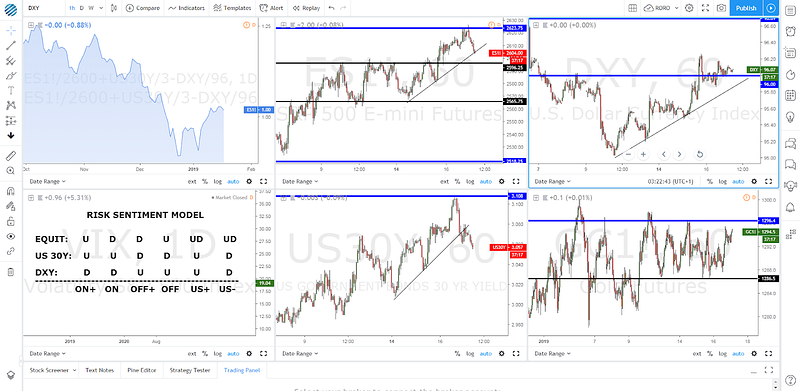
I am starting to see some cracks in the positive risk profile run we’ve seen since the beginning of the year. The long-dated 30-yr US bond yield, as a proxy for risk through fixed income markets, has breached its ascending trendline, sending the first red flags in the sustainability of risk. Even more cautious should be exercised owed to the inflection point the ES is deal at (2,620.00–30.00 daily resistance).
If an analogous behaviour is seen by a retake of the ascending trendline followed by a break back sub 2,600.00, it would provide further evidence that the tide in risk may be turning. The acceptance of Gold at such hefty levels near the top of its multi-week range just under 1,300.00 at a time when the DXY has been on a recovery mode for over 3–4 days now and equities have been trading with a bid tone, is a reflection that underneath the surface, the macro uncertainties predicated by fears of a global slowdown in activity are not incentivizing reallocations in investors’ portfolios.
Options — 25 Delta RR & Vols

* The 25-delta risk reversal is the result of calculating the vol of the 25 delta call and discount the vol of the 25 delta put. … A positive risk reversal (calls vol greater than puts) implies a ‘positively’ skewed distribution, in other words, an underperformance of longs via spot. The analysis of the 25-delta risk reversals, when combined with different time measures of implied volatility, allows us to factor in more clues about a potential direction. If the day to day pricing of calls — puts increases while there is an anticipation of greater vol, it tends to be a bullish signal to expect higher spot prices.
Source: http://cmegroup.quikstrike.net (The RR settles about 1am UK time).
Options — Ratio Imp/Hist Vol
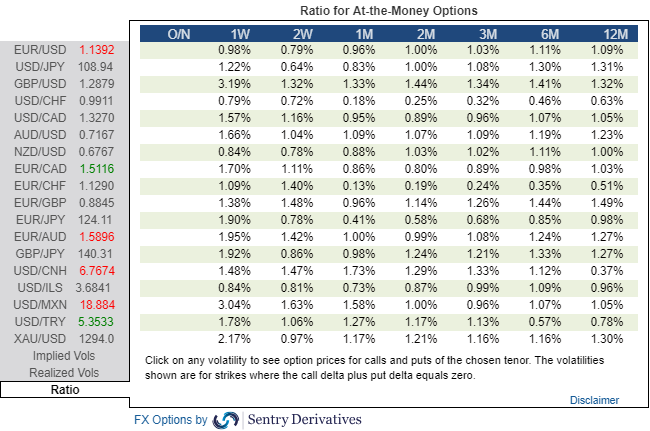
Find below today’s implied / historical vol levels.
* If implied vol is below historical vol, represented by a ratio < 1% in the table above, the market tends to seek equilibrium by being long vega (volatility) via the buying of options. This is when gamma scalping is most present to keep positions delta neutral, which tends to result in markets more trappy/rotational. On the contrary, if implied vol is above historical vol, represented by a ratio > 1%, we are faced with a market that carries more unlimited risks given the increased activity to sell expensive volatility (puts), hence why it tends to result in a more directional market profile when breaks occur. The sellers of puts must hedge their risk by selling on bearish breakouts and vice versa.
Important Footnotes
- Risk model: The fact that financial markets have become so intertwined and dynamic makes it essential to stay constantly in tune with market conditions and adapt to new environments. This prop model will assist you to gauge the context that you are trading so that you can significantly reduce the downside risks. To understand the principles applied in the assessment of this model, refer to the tutorial How to Unpack Risk Sentiment Profiles
- Cycles: Markets evolve in cycles followed by a period of distribution and/or accumulation. The weekly cycles are highlighted in red, blue refers to the daily, while the black lines represent the hourly cycles. To understand the principles applied in the assessment of cycles, refer to the tutorial How To Read Market Structures In Forex
- POC: It refers to the point of control. It represents the areas of most interest by trading volume and should act as walls of bids/offers that may result in price reversals. The volume profile analysis tracks trading activity over a specified time period at specified price levels. The study reveals the constant evolution of the market auction process. If you wish to find out more about the importance of the POC, refer to the tutorial How to Read Volume Profile Structures
- Tick Volume: Price updates activity provides great insights into the actual buy or sell-side commitment to be engaged into a specific directional movement. Studies validate that price updates (tick volume) are highly correlated to actual traded volume, with the correlation being very high, when looking at hourly data. If you wish to find out more about the importance tick volume, refer to the tutorial on Why Is Tick Volume Important To Monitor?
- Horizontal Support/Resistance: Unlike levels of dynamic support or resistance or more subjective measurements such as fibonacci retracements, pivot points, trendlines, or other forms of reactive areas, the horizontal lines of support and resistance are universal concepts used by the majority of market participants. It, therefore, makes the areas the most widely followed and relevant to monitor. The Ultimate Guide To Identify Areas Of High Interest In Any Market
- Trendlines: Besides the horizontal lines, trendlines are helpful as a visual representation of the trend. The trendlines are drawn respecting a series of rules that determine the validation of a new cycle being created. Therefore, these trendline drawn in the chart hinge to a certain interpretation of market structures.
- Correlations: Each forex pair has a series of highly correlated assets to assess valuations. This type of study is called inter-market analysis and it involves scoping out anomalies in the ever-evolving global interconnectivity between equities, bonds, currencies, and commodities. If you would like to understand more about this concept, refer to the tutorial How Divergence In Correlated Assets Can Help You Add An Edge.
- Fundamentals: It’s important to highlight that the daily market outlook provided in this report is subject to the impact of the fundamental news. Any unexpected news may cause the price to behave erratically in the short term.
- Projection Targets: The usefulness of the 100% projection resides in the symmetry and harmonic relationships of market cycles. By drawing a 100% projection, you can anticipate the area in the chart where some type of pause and potential reversals in price is likely to occur, due to 1. The side in control of the cycle takes profits 2. Counter-trend positions are added by contrarian players 3. These are price points where limit orders are set by market-makers. You can find out more by reading the tutorial on The Magical 100% Fibonacci Projection
The Daily Edge is authored by Ivan Delgado, Head of Market Research at Global Prime. The purpose of this content is to provide an assessment of the market conditions. The report takes an in-depth ...
more


No deal Brexit is dead in the water as it has to go back to parliament for approval via the mechanism of another no confidence vote (which would be lost this time), see:
seekingalpha.com/.../4234297-deal-brexit-will-never-pass-u-k-parliament
By default that makes a postponement of the Brexit inevitable as to hold an election or referendum or more negotiations will take months. However, the EU27 have to approve the reason for the extension so that takes us down to an election or referendum. Given that the government would likely be slaughtered in an election the referendum emerges as not only the least worst, but the only possible outcome. Buy £ but sell sterling assets as a high pound will hit stocks and house prices hard.
Well said.