

Photo by Colin Watts on Unsplash
EUR/GBP sold off aggressively after the UK posted a stronger flash PMI than that of the Euro Area.
Key Takeaways
- Euro Area rebounds with strong PMIs
- UK PMIs much stronger than expected; GBP goes bid
- EUR/GBP has its biggest one-day selloff in over a month
The flash readings of the S&P Global PMIs released earlier showed that both the Euro Area and the UK are turning a corner in terms of business activity. The EA Manufacturing PMI dropped to 48.5 vs a January reading of 48.8 and an expectation of 49.3 In contrast, the UK Manufacturing PMI rose to 49.2 vs 47 in January and 47.5 expected. However, it was the services sector that was steering the ship for the data. The EA Services PMI was 52.3 vs a prior reading of 50.3 and an expectation of 51. The UK Services PMI was 53.3 vs a prior reading of 48.7 and an expectation of 49.2! The Services PMIs set the table for nice gains in the overall Composite data. The EA Composite PMI was 52.3 vs a January reading of 50.3 and an expectation of 50.6. But the UK Composite PMI jumped to 53 vs a January reading of 48.5 and an expectation of 49. As a result of the stronger UK data across the board, GBP went bid and therefore, EUR/GBP moved lower.
On September 26th, 2022, EUR/GBP traded to its highest level since September 2020, near 0.9278 as former PM Liz Truss threw the markets into a frenzy with her budget plans. Order was restored over the next few days and by December 1st, 2022, EUR/GBP had made a low of 0.8547. Since then, the pair has bounced to the 61.8% Fibonacci retracement level from the September 26th, 2022 highs of the December 1st, 2022 lows near 0.8999. However, since late December, EUR/GBP has only been trading between 0.8715 and 0.8979. With the strong move in GBP today, the pair is having its biggest one-day selloff since January 17th, down -0.88% intraday. Notice that the price today broke below the 50-Day Moving Average for the first time since December 15th, 2022.
(Click on image to enlarge)

Source: Tradingview, Stone X
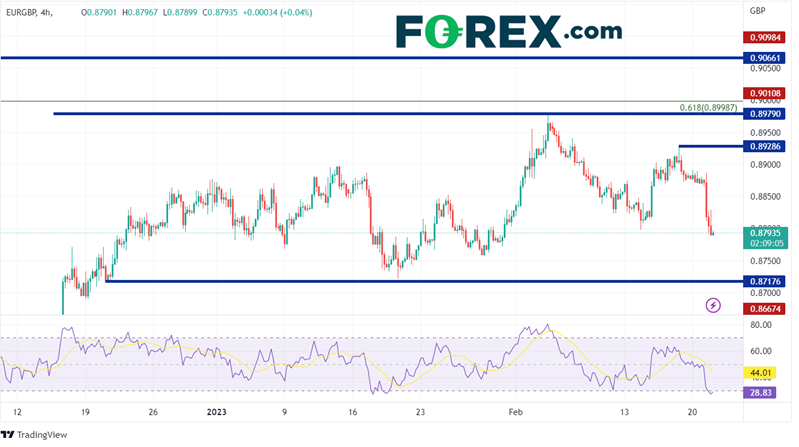
On a 240-minute timeframe, if EUR/GBP continues to move lower, the first support is at the lows from December 20th, 2022, at 0.8717. Below there, the price can fall to the 200 Day Moving Average at 0.8652 (see daily), then the lows of December 1st, 2022 at 0.8547. However, notice that the RSI on the 240-minute timeframe is in oversold territory. This indicates that the pair may be ready for a bounce. If EUR/GBP does bounce, the first resistance is at the highs from February 17th at 0.8929. The next resistance is a confluence of the highs from February 3rd and the above-mentioned 61.8% Fibonacci retracement level between 0.8979 and 0.8999. Above there, the price can move to the highs from September 28th, 2022, at 0.9066.
(Click on image to enlarge)
Source: Tradingview, Stone X
EUR/GBP sold off aggressively after the UK posted a stronger flash PMI than that of the Euro Area. The pair has been trading in a range for the last 2 months, however, today posted its biggest selloff since January 17th. Will it continue lower or does the oversold RSI on the 240-minute timeframe need to unwind and cause EUR/GBP to move higher?
More By This Author:
Do You Want To Trade USD/RUB? How About Trading USD/PLN Instead?U.S. Data Dump Points To Hawkish Sentiment From Fed
Is The Nasdaq 100 / Russell 2000 Ratio About To Scream Higher?


Comments
Log in or sign up to join the conversation.