
‘True Risk On’ Back In Vogue, Brexit Vote Awaits
Currency Strength Meter
In what was a low key affair, the Pound was the biggest mover. The Sterling tops the gainers’ leaderboard as UK PM May secured further concessions from the EU, while a ‘true risk on’ microenvironment led to a major deterioration in the pricing of the Japanese Yen as well as the US Dollar. Despite the renewed optimism on Brexit, the buying flows in the Euro were very limited in comparison. The Australian Dollar and the Kiwi did relatively well while the Canadian Dollar fell somewhere in the middle.

Main Narratives in Financial Markets
- UK PM May has secured legally binding changes that strengthen and improve the Brexit withdrawal agreement after the Strasbourg meeting with Juncker. Pound soared on the news.
- Despite not being a clear catalyst, stocks in the US posted very strong gains, with the S&P 500 ending about 1.5% higher while the Nasdaq Composite rose by over 2%.
- US Trump administration has released the $4.7T budget proposal for the fiscal year 2020, with the spending up almost 5% from the 2019-2020 budget.
- US retail sales for January, released with a delay due to the US government shutdown, came upbeat at 0.2% vs 0% exp while the core reading was even better at +0.9%. With regards to the prior month data, it was revised lower at -1.6% vs -1.2%.
Recent Economic Indicators & Events Ahead

Source: Forexfactory
RORO - Risk On Risk Off Conditions
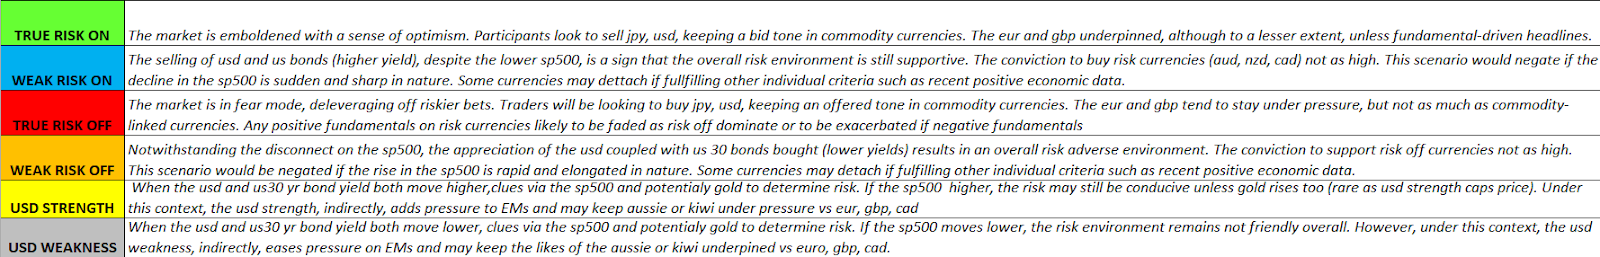

The massive gains in stocks, combined with the sharp selling of the DXY late on the day (driven by Brexit headlines), alongside the recovery in global yields with the US 30Y bond as the bellwether, classifies the current microenvironment as ‘true risk on’.
From a weekly perspective, which is the time horizon used to interpret the macro flows, the spike in equities has been so strong that even the 5-DMA slope has now turned positive, although this is still not backed up by fixed income, with the macro slope in yields still down, while the macro tendency in the US Dollar remains bullish.
What this means is that the ‘true risk on’ environment still needs to be taken as part of a ‘weak risk off’ context as per the RORO model. Remember, under such depressed vol conditions, excluding the GBP, the developing micro dynamics have become far more relevant to stay in tune with the fluid and constant change of market flows. In other words, notwithstanding the macro ‘weak risk off’, it’s the micro ‘true risk on’ that should be kept more present on everyone’s mind when coming up with your approach today.
Dashboard: Intermarket Flows & Technical Analysis


Summary: Intermarket Flows & Technical Analysis
EUR/USD: Piggybacking A Bullish GBP
- With the attention fully anchored around the latest Brexit developments, the Euro is acting as a proxy to the flows in the Sterling, further assisted by a softer USD tone.
- Expect volatility to increase from the normal depressed levels as a result as the UK prepares to vote on the amended Brexit withdrawal agreement.
- The playbook for the Euro is likely to deviate away from the tight correlation with the German vs US yield spread to instead behave more erratically conditioned by Brexit.
- The 2-day recovery post the elongated ECB-induced sell-off is testing a critical level of resistance as per the intersection of a descending trendline circa 1.1275.
- The market is structurally bearish with an increasing number of supply clusters from 1.1275 up to 1.1325, with bids through 1.13 to test the ECB-led supply origin.


GBP/USD: Monster Move As Brexit Optimism Is Back
- The Sterling has an impressive 300 pips + outlier day as reports emerge that the UK has secured a concession with the EU to improve the Brexit divorce deal.
- The spike looks overdone based on the status of the correlated instruments, although the erratic algos-led vol this week is likely to see a decoupling of reliable correlations.
- Starting from 1.3190-1.3200, there are well-defined areas where most buying interest is expected as per the most recent highs, lows and demand origins.
- Trading the Sterling is going to be extremely tricky as episodes of high vol should be expected on a headline-by-headline basis as the next Brexit vote is just hours away.


USD/JPY: Buy On Dips Re-Emerges As Risk Recovers
- The buy on weakness strategies have flourished in the last 24h of trading after an aggressive ‘true risk on’ swing led by a strong rise in stocks.
- The next area of critical supply is found from 111.50. Once offers start to get filled on a retest, monitor very closely the trifecta of equities, fixed income, DXY to plan your trading approach.
- As the correlation dynamics stand by the end of business in NY, the areas highlighted in green should attract solid buy-side interest as long as the cross-asset flows are conducive.


AUD/USD: Re-Testing A Critical Supply Area
- Negative fundamentals continue to pile up against the Aussie following the latest downbeat NAB business conditions/confidence, leading to a test of Monday’s POC.
- From a micro perspective, the performance of the DXY + Yuan, coupled with the mood in the equity market, has acted as the key determiners of the Aussie direction.
- From a macro perspective, the AU-US bond yield spread continues to be, alongside equities, the most reliable indicator to gauge the next direction in detriment of the DXY +Yuan flows.
- The short-term recovery has the characteristics of being very corrective in nature vs the more impulsive reaction during the latest selling period. A bad omen from an order flows standpoint.
- As intermarket flows stand, with equities on the rise and the DXY weaker across the board, any dips still represent a buying opportunity even if the upside looks technically quite limited.


USD/CAD: Transition From Bullish Trend Into A Range
- The micro weakness in the DXY and the US-CA bond yield spread since last Friday has resulted in the establishment of a consolidation period.
- We are going through a low correlation period with Oil, so pay a lot more attention to the combination of DXY and bond yield spreads to stay on the right side of the market.
- The BOC-led demand from March 6th keeps acting as a firm area of demand to absorb the latest selling rounds, which does make sense on macro bullish DXY + US-CA yield spreads.
- Any re-adjustment higher in the micro slope of the DXY and/or the bond yield spread makes the current area sub 1.34 an attractive buy-side proposition.


Important Footnotes
- Risk model: The fact that financial markets have become so intertwined and dynamic makes it essential to stay constantly in tune with market conditions and adapt to new environments. This prop model will assist you to gauge the context that you are trading so that you can significantly reduce the downside risks. To understand the principles applied in the assessment of this model, refer to the tutorial How to Unpack Risk Sentiment Profiles
- Cycles: Markets evolve in cycles followed by a period of distribution and/or accumulation. The weekly cycles are highlighted in red, blue refers to the daily, while the black lines represent the hourly cycles. To understand the principles applied in the assessment of cycles, refer to the tutorial How To Read Market Structures In Forex
- POC: It refers to the point of control. It represents the areas of most interest by trading volume and should act as walls of bids/offers that may result in price reversals. The volume profile analysis tracks trading activity over a specified time period at specified price levels. The study reveals the constant evolution of the market auction process. If you wish to find out more about the importance of the POC, refer to the tutorial How to Read Volume Profile Structures
- Tick Volume: Price updates activity provides great insights into the actual buy or sell-side commitment to be engaged into a specific directional movement. Studies validate that price updates (tick volume) are highly correlated to actual traded volume, with the correlation being very high, when looking at hourly data. If you wish to find out more about the importance tick volume, refer to the tutorial on Why Is Tick Volume Important To Monitor?
- Horizontal Support/Resistance: Unlike levels of dynamic support or resistance or more subjective measurements such as fibonacci retracements, pivot points, trendlines, or other forms of reactive areas, the horizontal lines of support and resistance are universal concepts used by the majority of market participants. It, therefore, makes the areas the most widely followed and relevant to monitor. The Ultimate Guide To Identify Areas Of High Interest In Any Market
- Trendlines: Besides the horizontal lines, trendlines are helpful as a visual representation of the trend. The trendlines are drawn respecting a series of rules that determine the validation of a new cycle being created. Therefore, these trendline drawn in the chart hinge to a certain interpretation of market structures.
- Correlations: Each forex pair has a series of highly correlated assets to assess valuations. This type of study is called inter-market analysis and it involves scoping out anomalies in the ever-evolving global interconnectivity between equities, bonds, currencies, and commodities. If you would like to understand more about this concept, refer to the tutorial How Divergence In Correlated Assets Can Help You Add An Edge.
- Fundamentals: It’s important to highlight that the daily market outlook provided in this report is subject to the impact of the fundamental news. Any unexpected news may cause the price to behave erratically in the short term.
- Projection Targets: The usefulness of the 100% projection resides in the symmetry and harmonic relationships of market cycles. By drawing a 100% projection, you can anticipate the area in the chart where some type of pause and potential reversals in price is likely to occur, due to 1. The side in control of the cycle takes profits 2. Counter-trend positions are added by contrarian players 3. These are price points where limit orders are set by market-makers. You can find out more by reading the tutorial on The Magical 100% Fibonacci Projection
The Daily Edge is authored by Ivan Delgado, Head of Market Research at Global Prime. The purpose of this content is to provide an assessment of the market conditions. The report takes an in-depth ...
more

