
The Most Important Chart On The Planet
This past week in the precious metals sector we have seen some volatility that felt just the opposite of what we saw in the bear market years, when we would get a sharp rally that would last for several days. In bear markets, they shakeout the shorts and call it a short covering rally. It’s a bit too early to know for sure but Thursday’s big reversal day felt like a shakeout day, which shook out many PM bulls or at the very least made them fell very uncomfortable holding on to their positions.
These types of shakeout moves are very healthy for keeping the impulse move going. Instead of correcting in time, the correction comes in price. The hallmark of these kinds of shakeout moves is that they should be over in one to five days with the original trend exerting itself again very quickly. So this week is going to be very interesting to see if the PM complex can take out the previous highs and hold.
Today I would like to update some charts we’ve been following which suggest that it’s still prudent to hang on to your PM positions for dear life as Sir Spock and Sir Plunger have been stating. I’ve written about inflection points in the past and the US dollar is at a critical inflection point right now. For me personally, I’m willing to hang on and see what happens with the US dollar, as the risk to reward ratio is pretty high for the precious metals sector if the US dollar breaks down from here. These potential setups don’t come around very often but if you can spot one early enough they can be very rewarding if you can hold your ground.
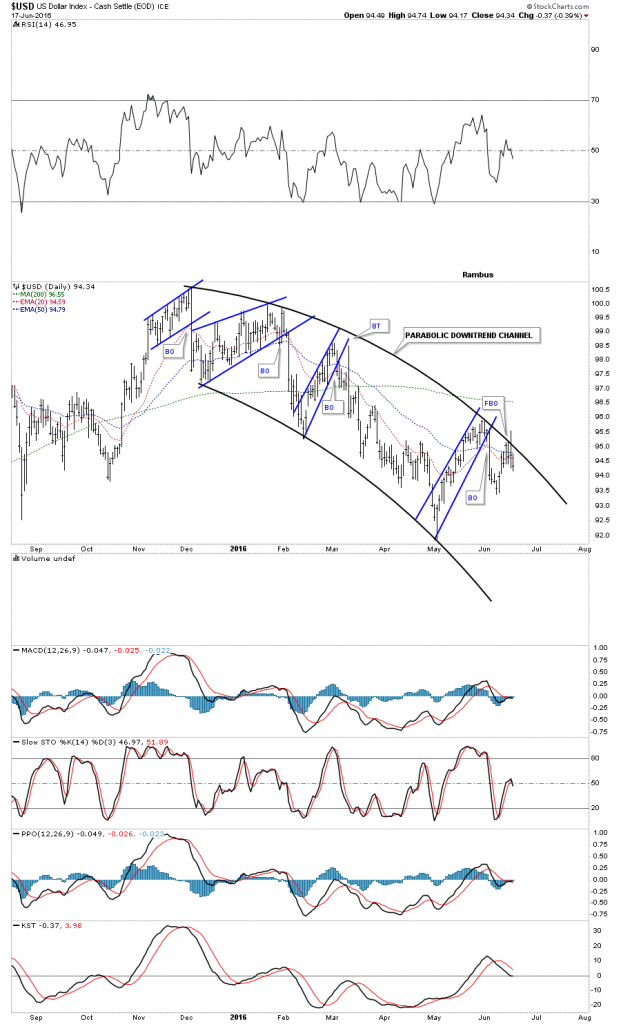
The first chart I would like to show you is a short term daily chart for the US dollar that we looked at last week, which showed a possible parabolic downtrend channel building out. The key word being parabolic. During all the volatility on Thursday the US dollar spiked above the top of the parabolic channel, which at the time looked like it may be failing. The US dollar quickly reversed back down and by the end of the day it closed back inside the channel, which has negated the breakout so far.
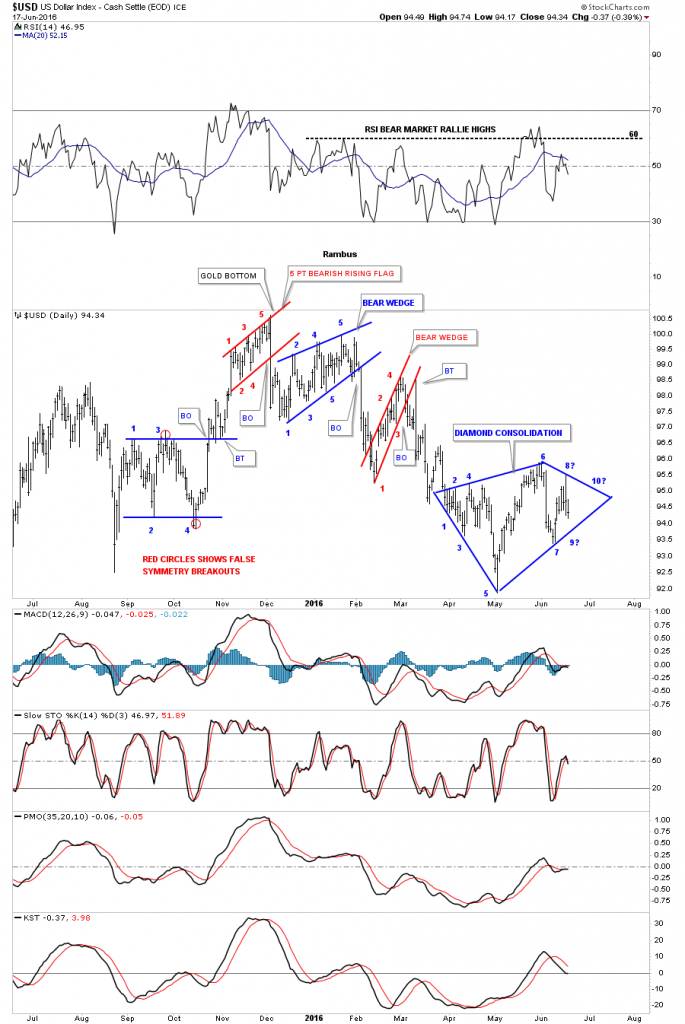
Since April of this year the US dollar has been bouncing around wildly looking for direction but hasn’t found it yet. Below is another daily chart for the US dollar which may be showing us what all the chopping around is creating. A Diamond will start out as an expanding triangle of some kind which suggests the investors are very confused. The price action gyrates making a higher high and a lower low going nowhere. Note the rally out of reversal point #5 all the way up to reversal point #6 which shows you the expanding price action.
The right side of a Diamond usually consists of a triangle of some kind with converging top and bottom trendlines. Until Thursday’s wild price action this pattern didn’t exist. Now however, we can start to see the formation of a possible triangle pattern forming on the right side of the pattern. Notice how tight the price action was at the beginning of the Diamond between reversal points #1 and #2 and reversal points #3 and #4. The symmetry suggests that we could see some serious chopping action out toward the apex on the right side of the Diamond where we could see reversal points #9 and #10 form. It doesn’t have to happen but I’m prepared mentally if it does. As I’ll show you on the following chart, where this potential Diamond is forming, is also a very good clue for us.
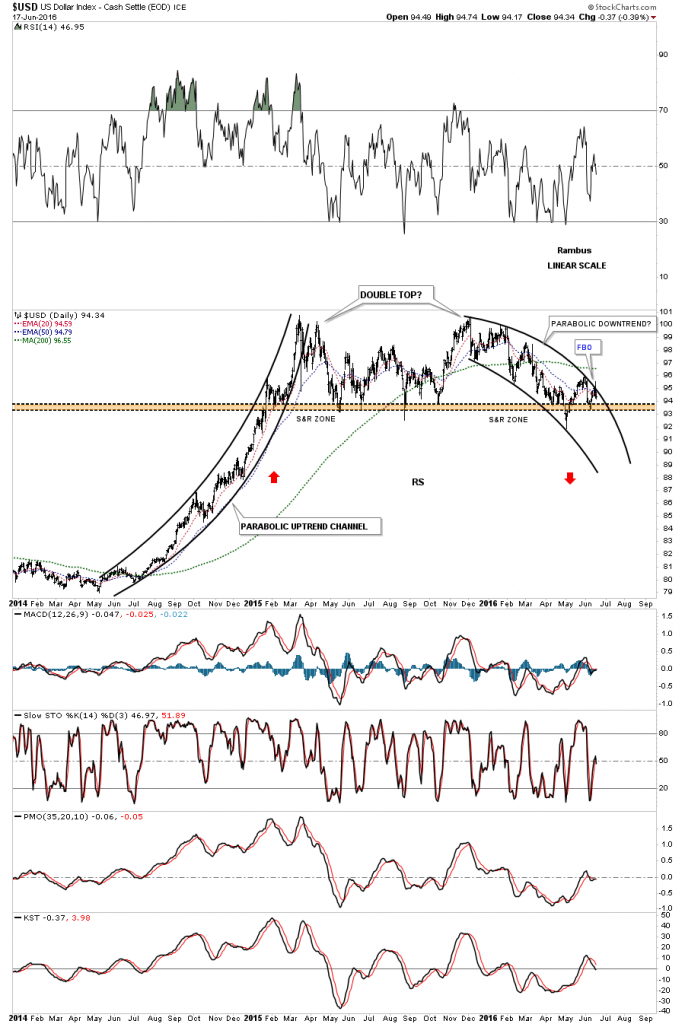
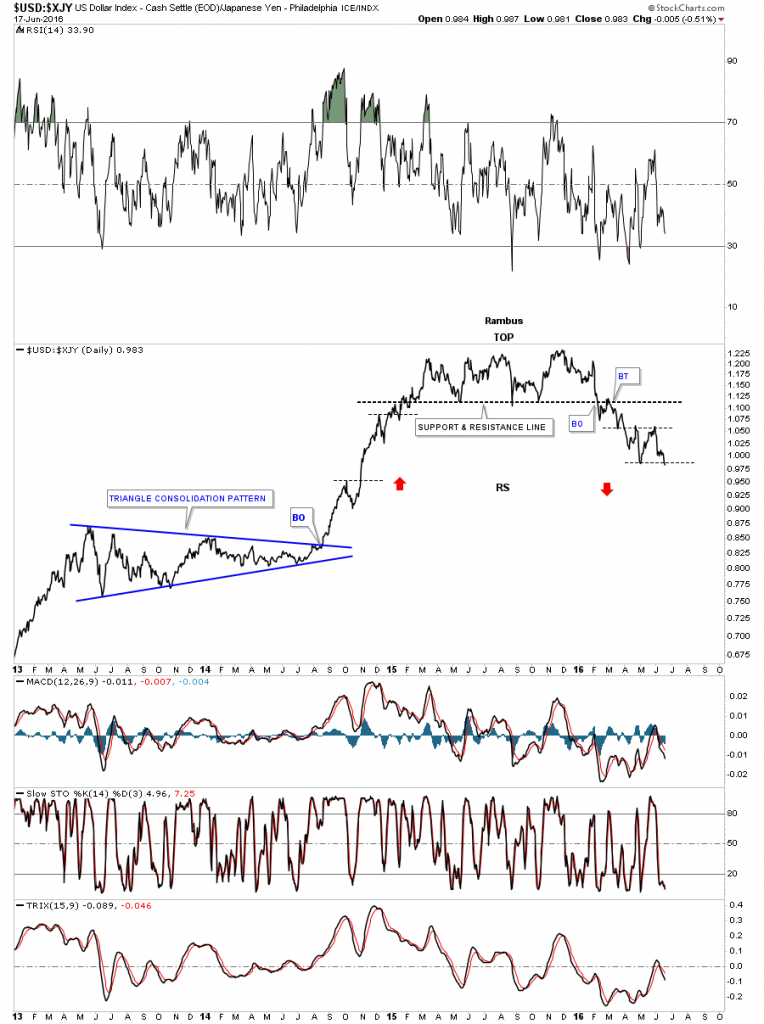
Below is the other chart for the US dollar we looked at last week, which is a longer term daily chart showing the possible parabolic downtrend channel, going all the way back to July of 2014 when the US dollar had that massive impulse move up. Since the initial top in March of 2015 the US dollar has been chopping sideways with a well defined top and bottom boundary. Right now this is the inflection point where the US dollar can bounce off the bottom S&R zone, or if the Diamond plays out as a consolidation pattern to the downside, the price action will break below the all important S&R zone. If the US dollar breaks below the brown shaded S&R zone that will complete a double top reversal pattern. If that were to happen we could very well see some reverse symmetry to the downside as shown by the red arrows. This is one of the main reasons why I chose to hang on until something changes this scenario. The price action will let us know of the US dollar’s intentions.
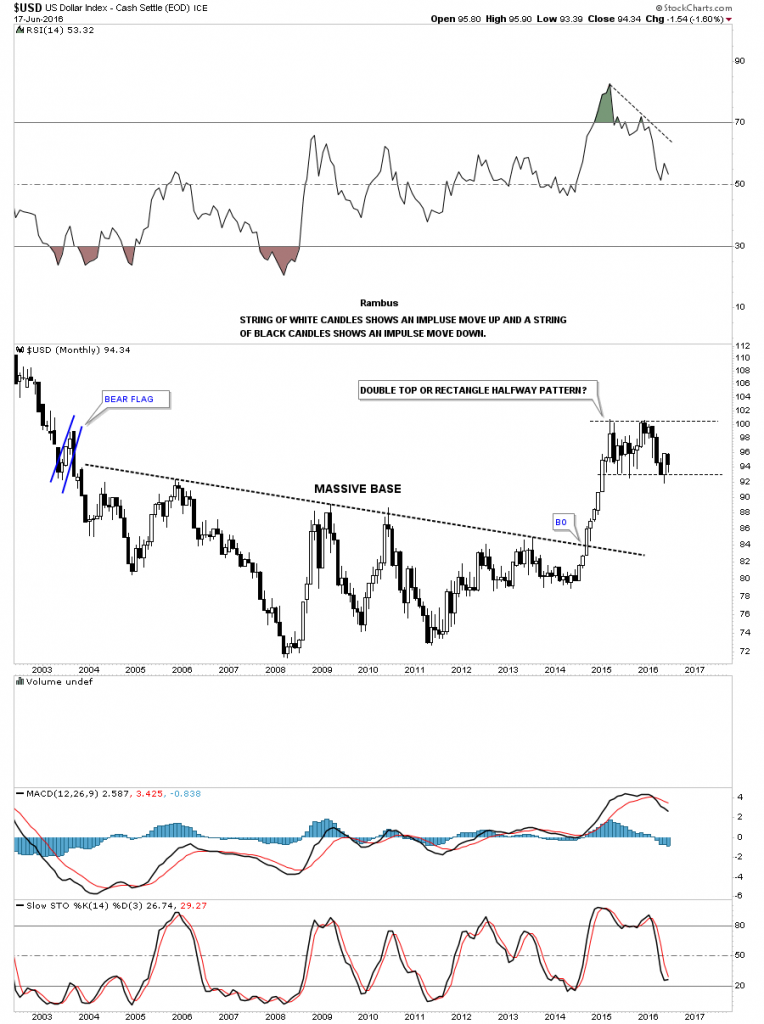
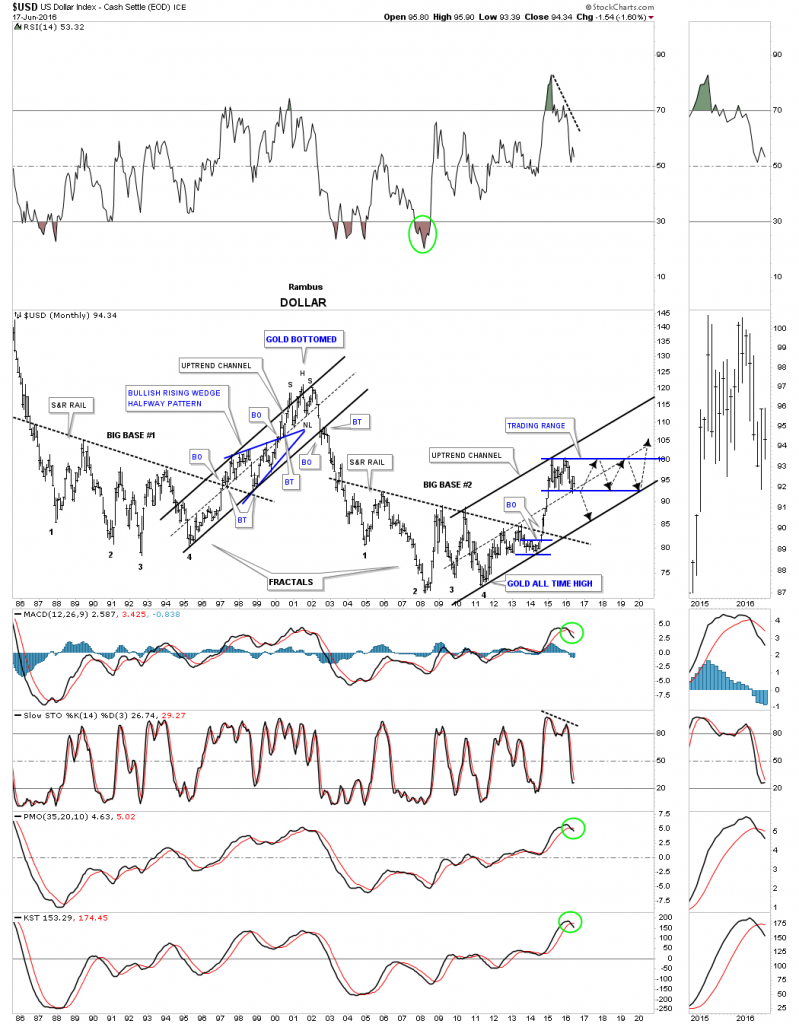
Below is the monthly candlestick chart for the US dollar we’ve following for a very long time, which also shows how important this inflection point is right here. The price action has completed three reversal points so far. This is the area where the bulls need to defend this third reversal point and rally the US dollar back up to the top of the trading range. If they fail, the white candlesticks shows how the reverse symmetry may play out to the downside.
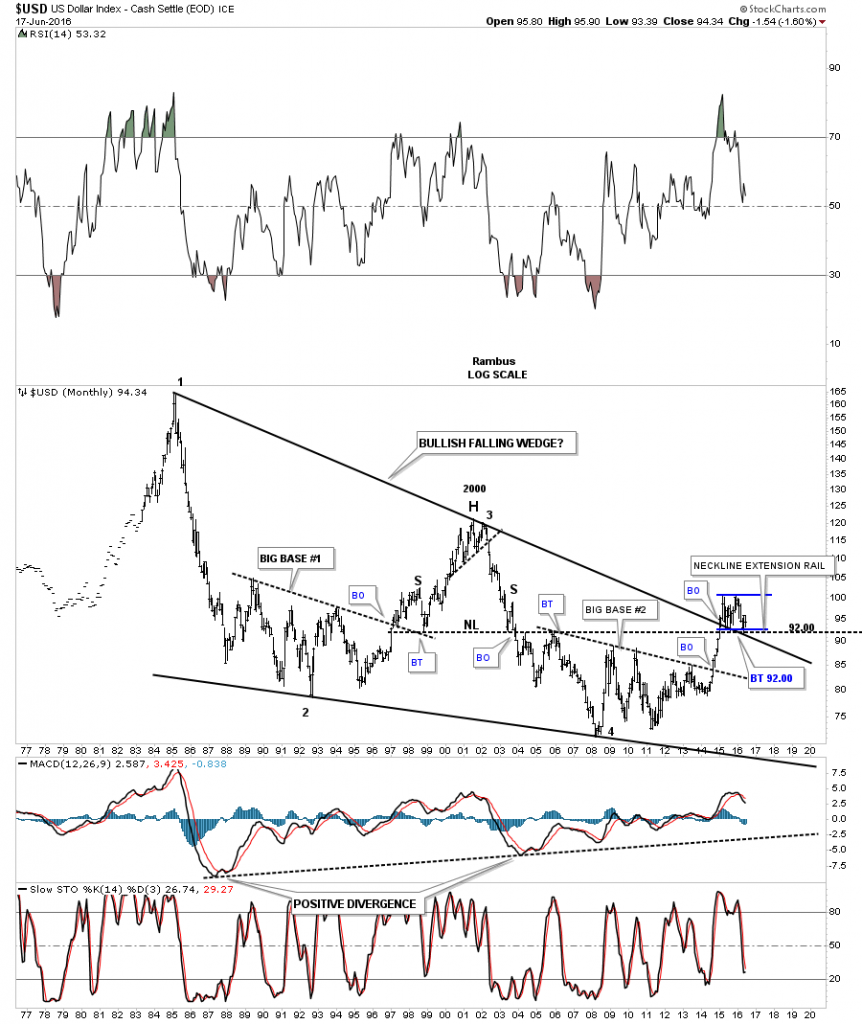
This next very long term monthly look at the US dollar shows two critically important support lines coming into play at 92 or so. First, there is the top rail of the 30 year falling wedge. Next we have the neckline extension rail taken from the massive H&S top that also comes into play at the 92 area. As you can see the US dollar has already bounced one time off those two S&R lines about a year ago, which has setup the bottom of our current trading range.
In an uptrend channel the price action can move between the two trendlines by either trading sideways in time or decline in price until the lower trendline is hit.
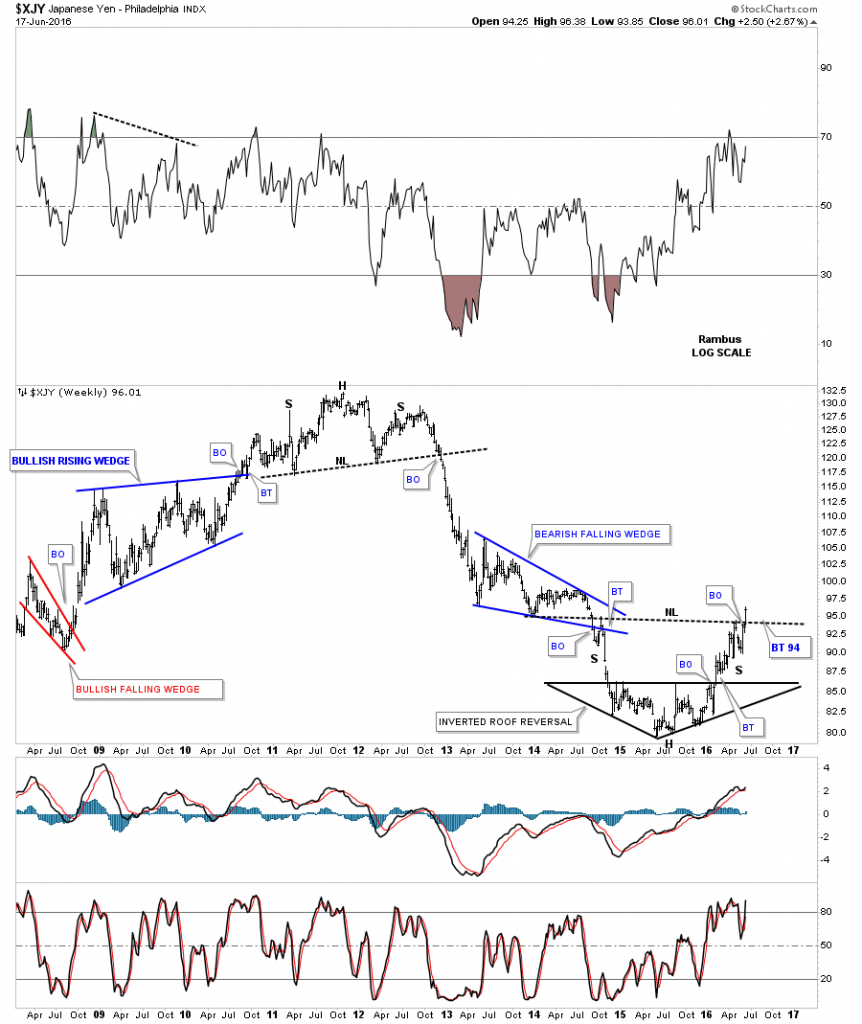
There was a big development in the $XJY this week when it broke back above big neckline #2 which is also creating a neckline for an inverse H&S bottom. Now we need to see the inverse H&S bottom neckline hold support, or if there is a backtest the 94 area should hold support. Big neckline #2 also shows you a good example of how the price action interacts with an important trendline as it changes from support to resistance and back again as is the case right now.
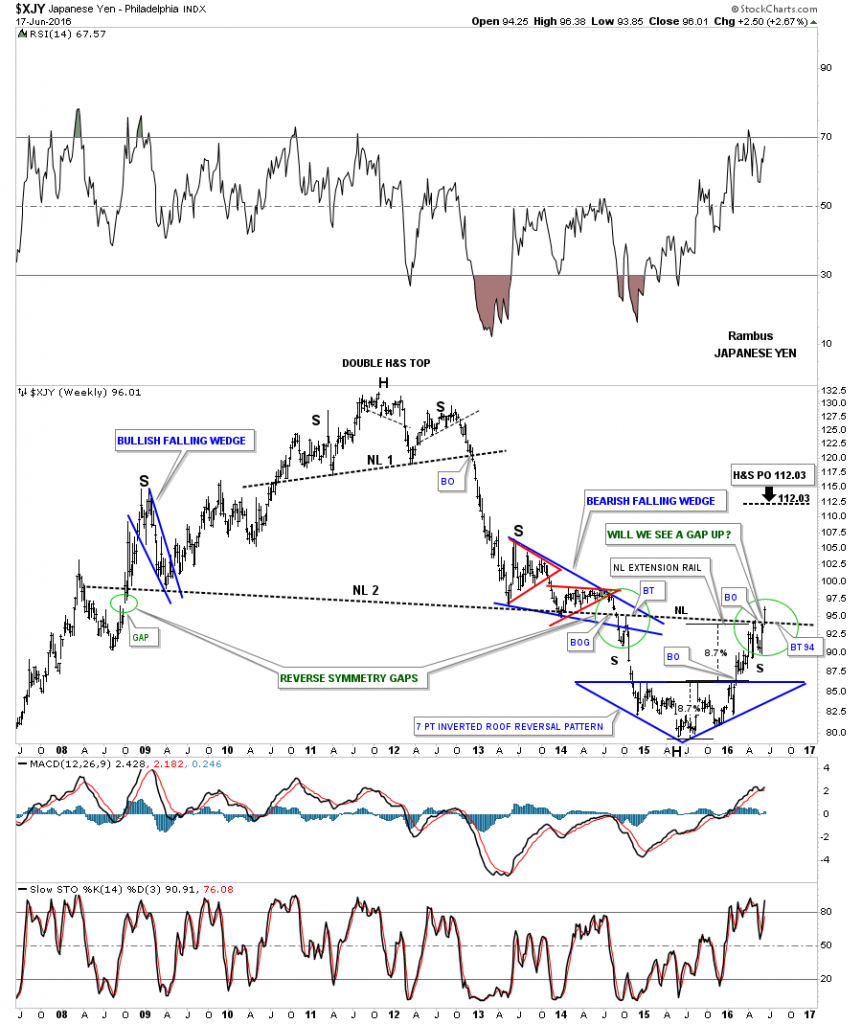
Below is a short term weekly look which shows the inverse H&S bottom forming with the 7 point inverted roof forming the head. We have a very clear line in the sand with the neckline. Above is positive, and below is negative, and everything else is noise.
Even though the euro makes up the biggest percentage of the US dollar, gold seems to be following the Japanese Yen much more closely. Lets look at a few of the $USD:$XJY ratio charts we’ve been following that may give us some insight on how this ratio is affecting gold. Below is a six year daily line chart for the ratio, which is showing it has built out a nice top. Since breaking below the S&R line this ratio has been making lower lows and lower highs, and is right on the verge of making another lower low. As you can see the reverse symmetry isn’t tic for tic, but shows you what I mean by reverse symmetry, as shown by the red arrows. On the left side of the chart this ratio made higher highs and higher lows, and on the right side of the chart just the opposite.
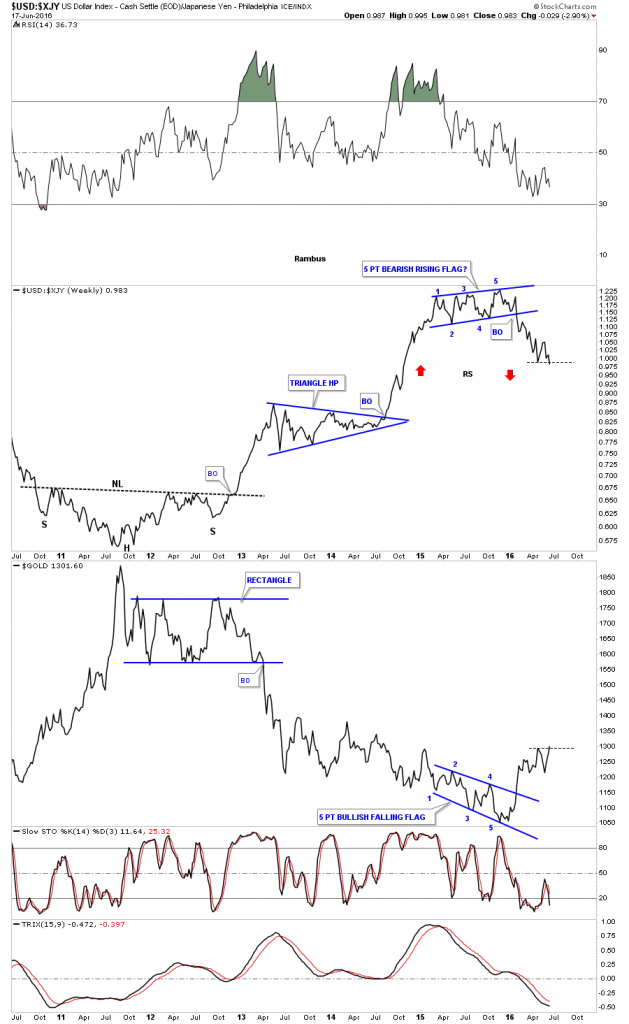
Below is a weekly line ratio combo chart, that’s a mouth full, which has the USD:XJY on top and gold on the bottom, which does a good job of showing the inverse correlation these two have. The ratio chart on top shows it built out a five point bearish rising flag as its reversal pattern, refer to daily chart above. Gold on the other hand built out an inverse looking five point bullish falling flag reversal pattern. Note how both of them are touching their small horizontal black dashed S&R lines presently. This combo chart suggests that it’s not time to sell your precious metals stocks right now, especially if the ratio chart on top breaks down again.
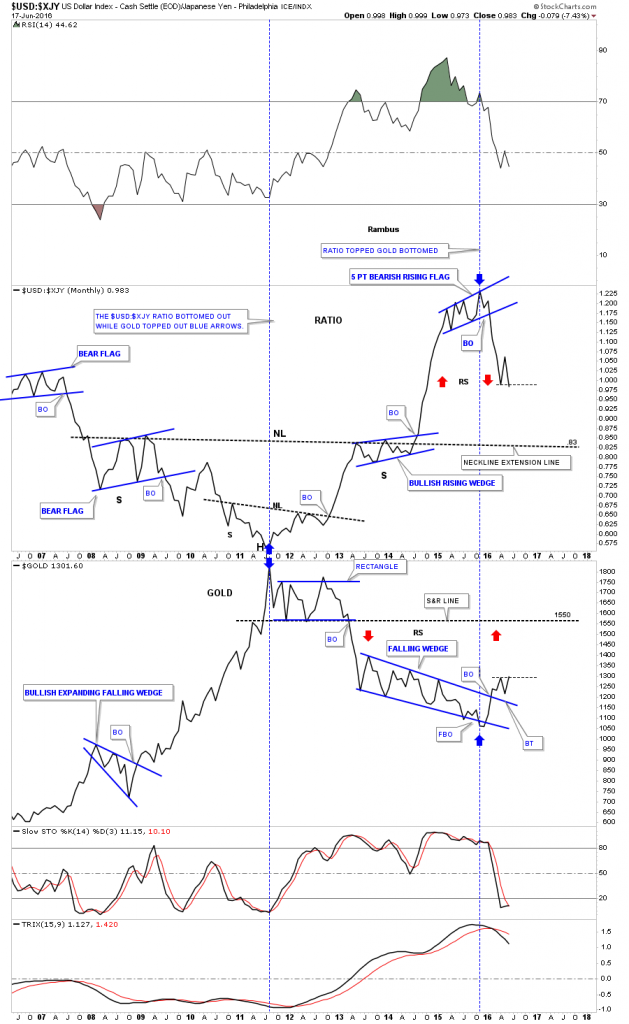
I believe this next ratio combo chart for the US:XJY may give us a good place for this initial rally phase to end in the precious metals complex. This long term monthly line chart has two important support and resistance lines that will give us a heads up, especially if they reach their respective trendlines at the same time. Looking at the ratio chart on top you can see a very large H&S bottom in which I extended the neckline to the right side of the chart, which is known as a neckline extension line. The reverse symmetry suggests this is the first logical area to look for support at the .83 area.
Gold has a similar very important S&R line, which is taken from the bottom rail of the rectangle consolidation pattern, which formed gold’s first important bear market consolidation pattern. When that rectangle gave way back in April of 2013, it was considered by most to be manipulation that took gold down. I seen a massive six point rectangle consolidation pattern that was mature and was ready to break down. Either way, that breakout point is a very important area on the chart at 1550. Note how this ratio combo chart shows gold’s bull market high in 2011, and the bottom of the bear market in November of 2015, blue arrows. As you can see both the ratio chart on top and gold on the bottom are sitting right on their horizontal dashed S&R line waiting for their next move to begin.
I would like to thank everyone who takes the time to post their ideas and charts at the forum. I would also like to thank Sir Fullgoldcrown for keeping the forum under control and a place for learning and sharing ideas. That was our goal on the front end and it has worked out very well. I don’t know if anyone realizes it but Sir Fully also is my editor and puts the titles on my Wednesday and Weekend Reports. Thanks Sir Fullgoldcrown and Happy Father’s Day to you, and everyone else who is a father. All the best…Rambus
Disclosure: None.


