

Image Source: Unsplash
The Kiwi with ticker NZDUSD is finally on the rise after we noticed an A-B-C corrective decline in wave (2) on a daily chart. We warned about that with an article shared on April 10.
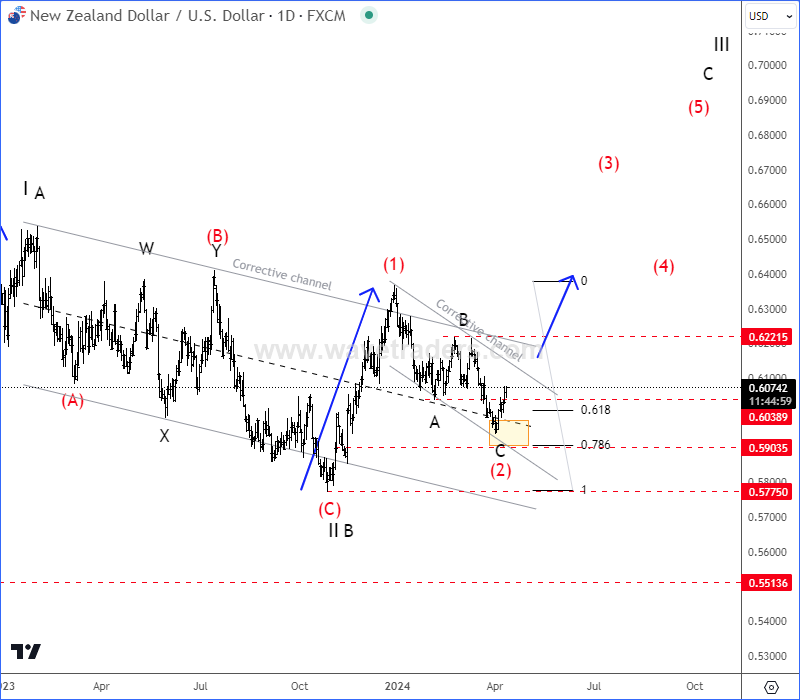
NZDUSD Daily Chart From April 10
As you can see today on May 29, we can see price nicely bouncing and impulsively recovering, which can be signal that support is in place, especially after RBNZ hawkish shift. So, more upside can be seen within impulsive recovery, just be aware of short-term pullbacks. Alternatively, there’s also a chance for a bullish triangle pattern, but in both cases we expect higher prices at least up to 0.65 – 0.70 area or higher.
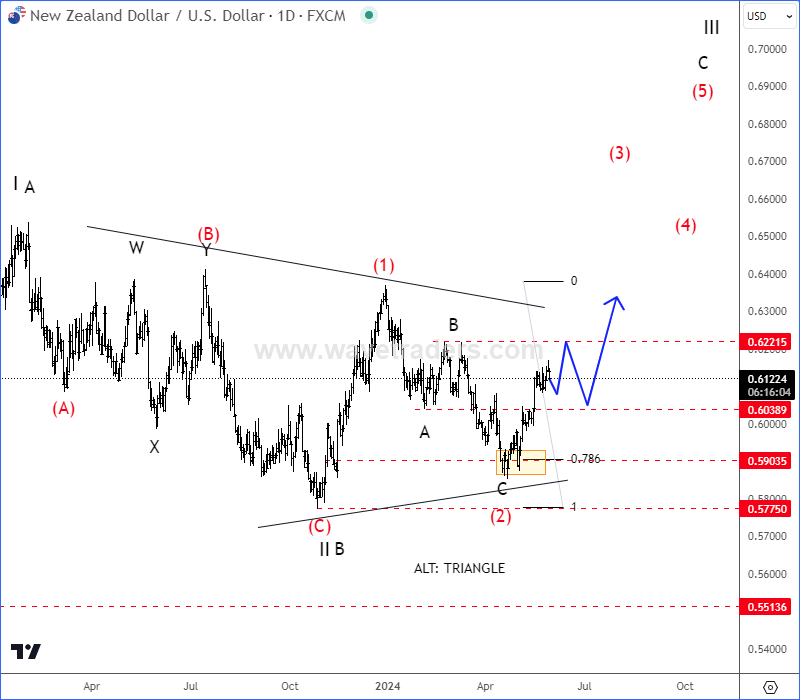
NZDUSD Daily Chart From May 29
More By This Author:
SP500 Is Unfolding A Five-Wave Bullish Impulse
Potential ECB Cut And UK CPI Data Can Cause Drop On EURGBP Out Of An Elliott Wave Triangle
Bitcoin Dominance Is Slowing Down In The Bullish Crypto Market; ALTcoins Are Ready


Comments
Log in or sign up to join the conversation.