
The Euro Bulls Appear Really Short Of Breath
We're seeing some nice moves in the currencies today. After a couple of days hesitating, the euro has made a profitable move lower. The loonie bulls aren't making much headway either. Today is simply a risk-off day. In days like this, it's important to be positioned correctly just as the preceding move is running out of steam. The market is full of clues for those willing to listen. For those ready to profit.
EUR/USD - The Pair Is Rolling Over
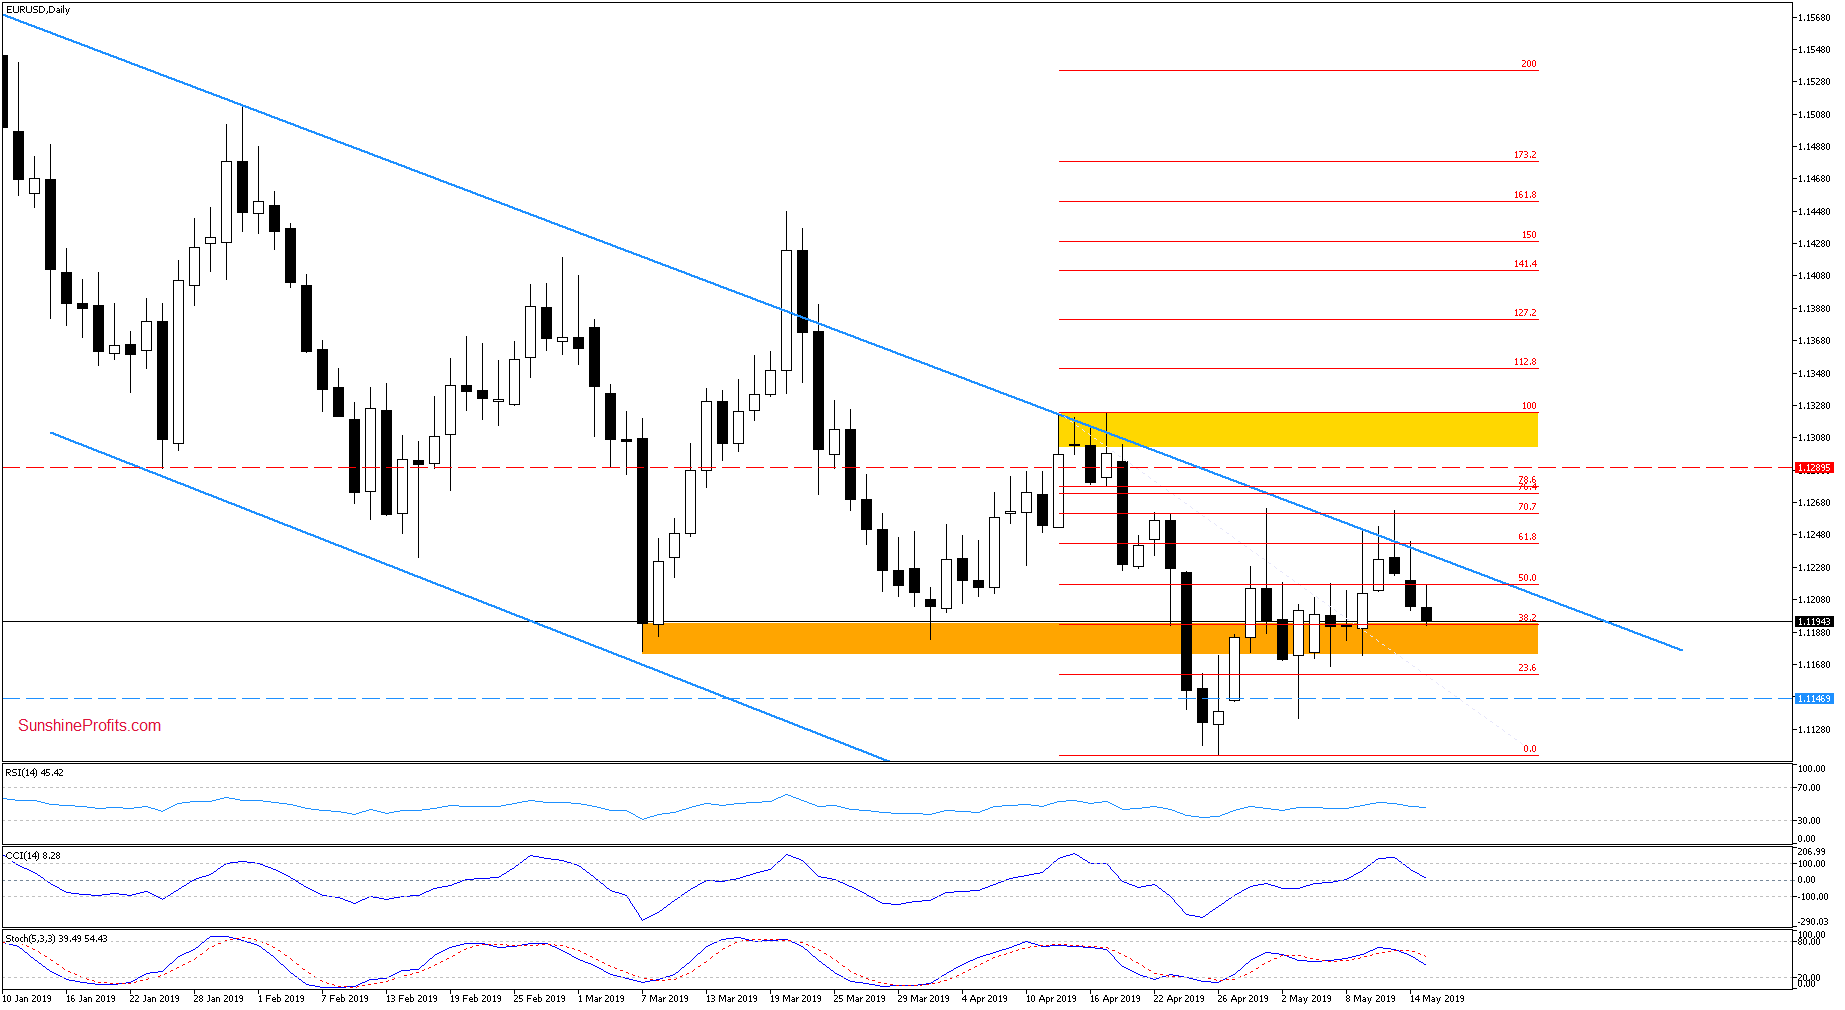
The euro bulls' breakout attempts have clearly failed. Taking a cue from Monday, EUR/USD has reversed lower also yesterday. And it's the same story earlier today, too. Needless to say that this has made our short position even more profitable. The pair trades currently close to its daily lows, at around 1.1185.
The exchange rate trades well below the upper border of the declining blue trend channel as seen on the daily chart. It's currently attacking the early- and late-March lows as marked by the orange support line. It's the same line the pair has already broken below in late April.
Additionally, the daily indicators continue to support the sellers. See for yourself the sell signals generated by the CCI and Stochastics.
USD/JPY - Digesting the Recent Downswing
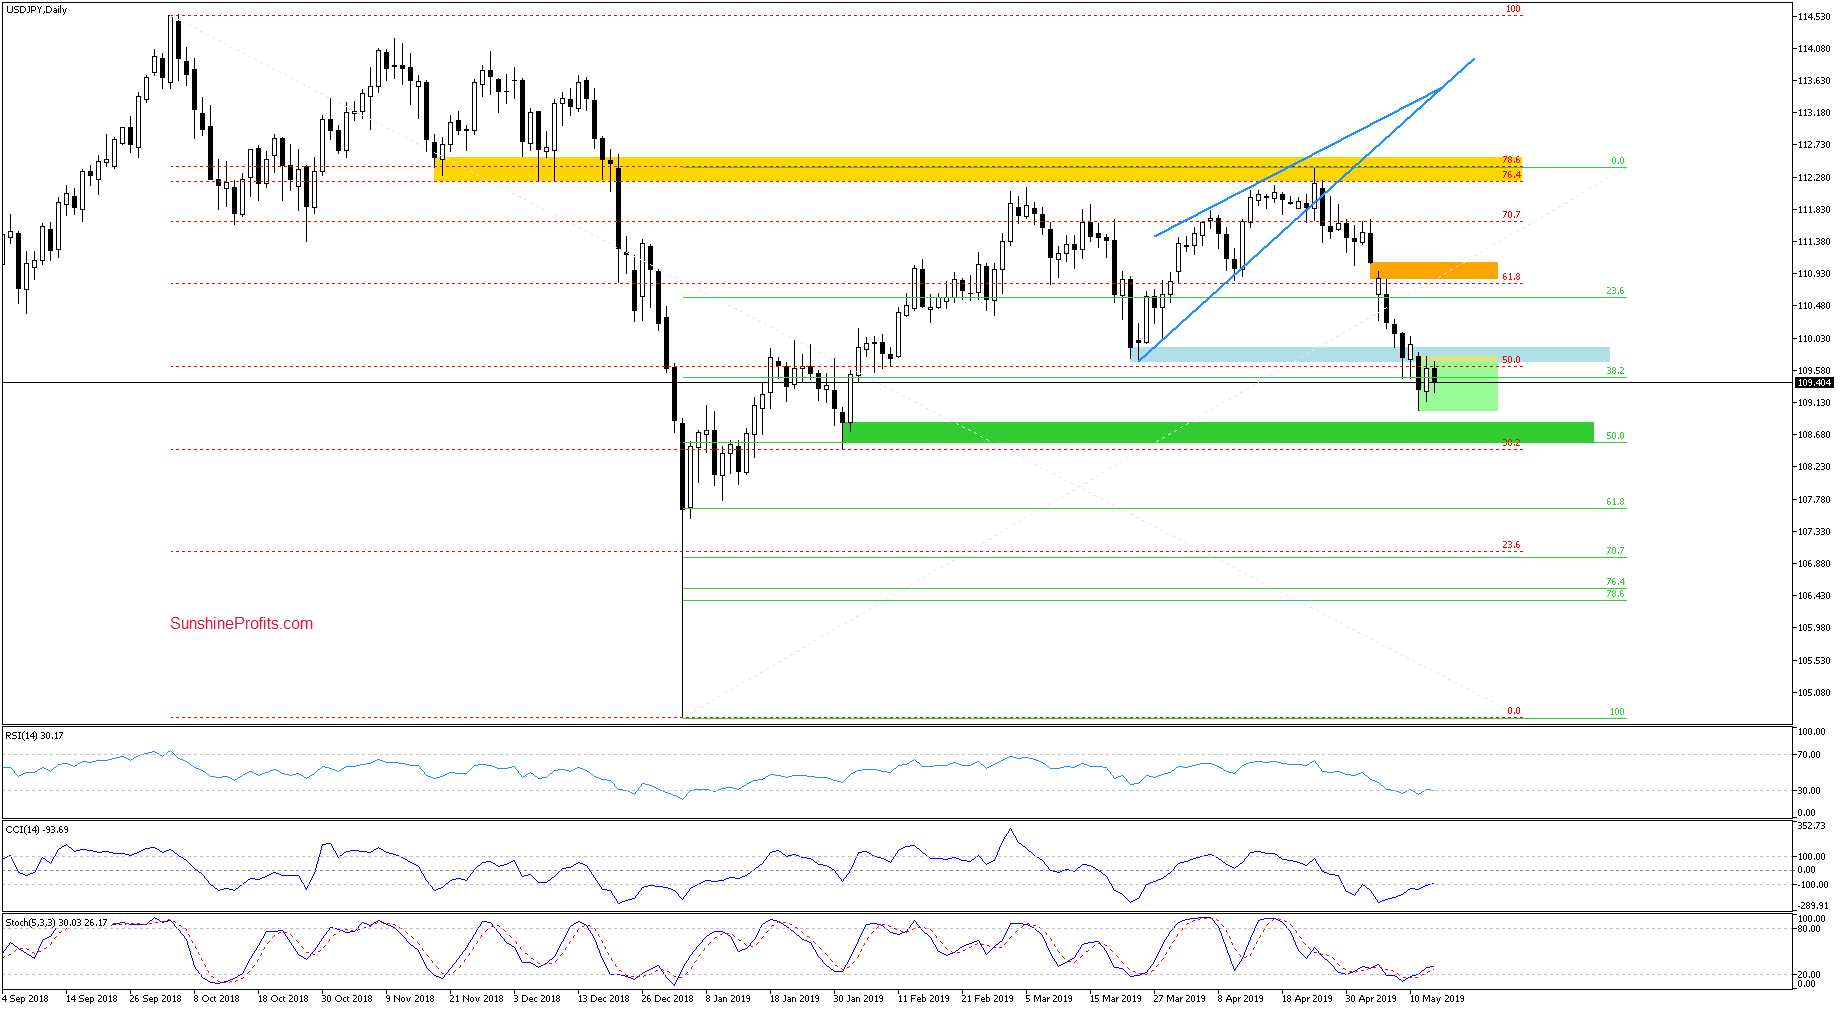
On Monday, USD/JPY broke below the blue support zone only to retrace much of the downside move the day after. This price action is marked as the green consolidation on the above daily chart. Neither earlier today have the bulls managed to invalidate the breakdown.
To the contrary, the rate changes hands at around 109.20 currently. This fits the picture of what usually happens after a breakdown invalidation attempt fails. How far could the current downswing carry the bears?
The current position of the daily indicators and the proximity to the green support zone (the late-Jan lows) suggest that the space for declines may be limited. A reversal in the coming days should not surprise us.
USD/CHF - Downside Target Reached
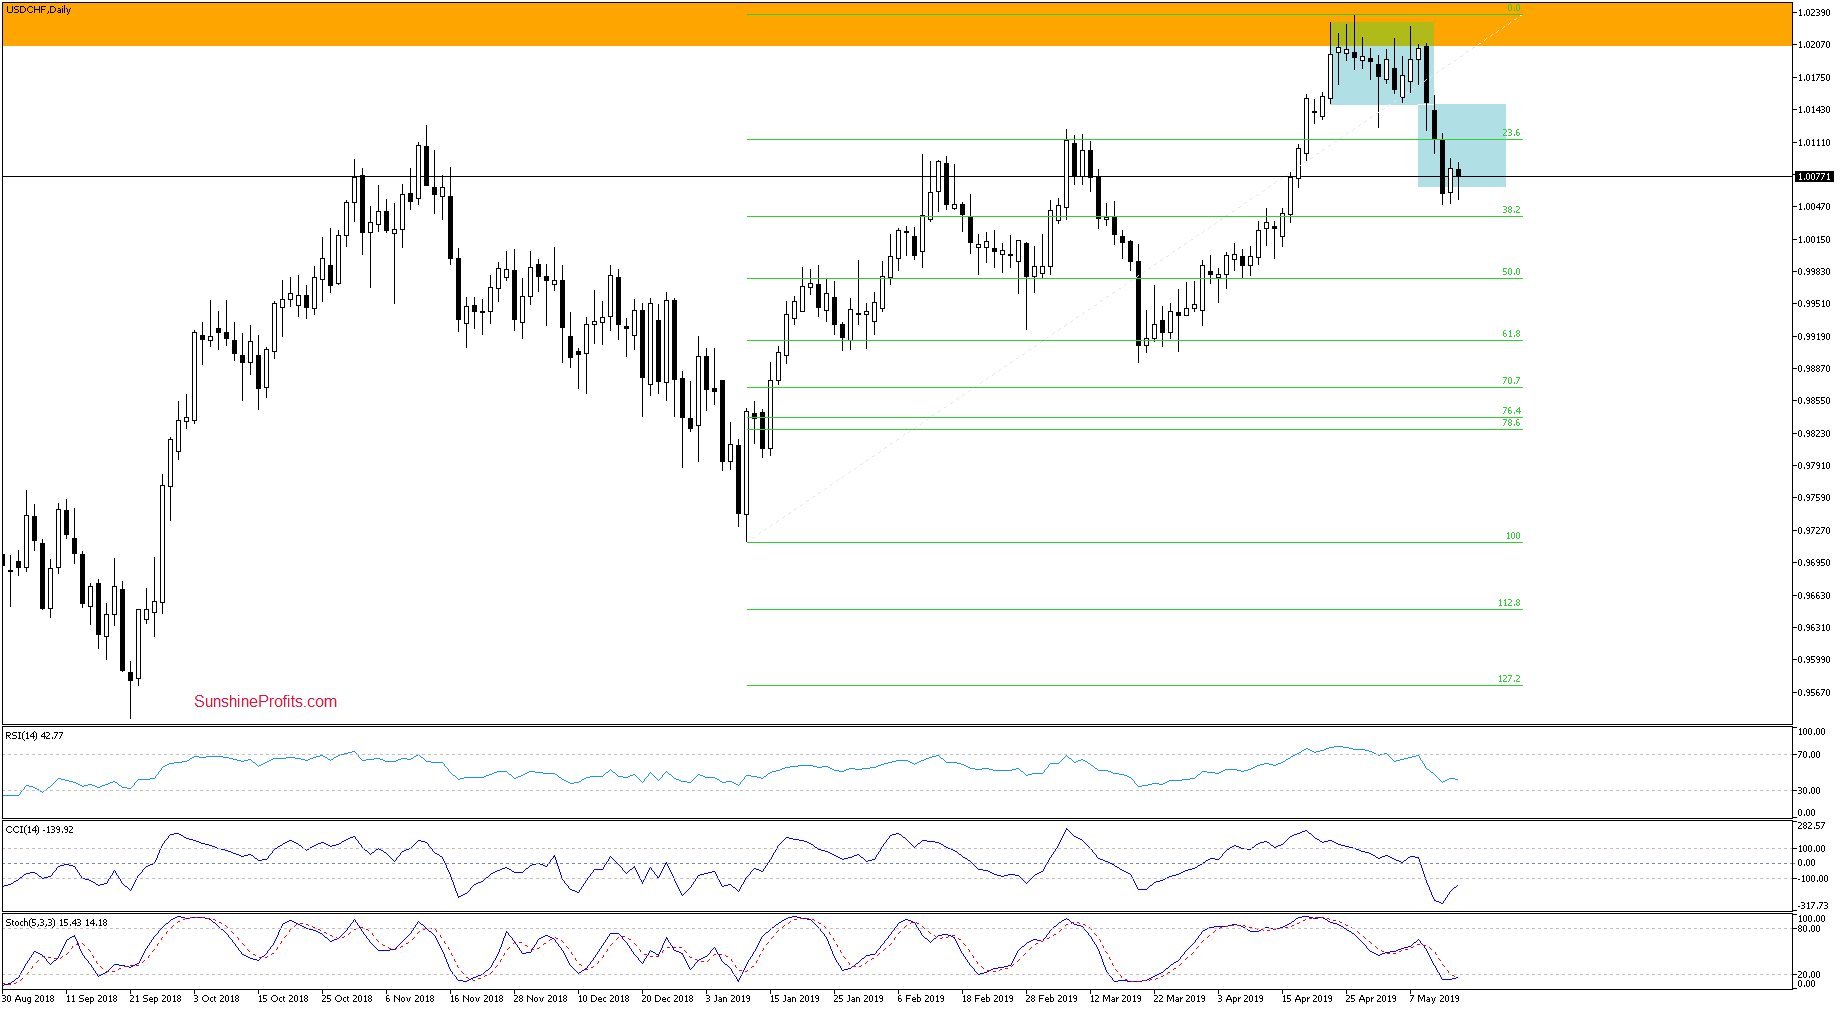
On Monday, the USD/CHF downward price momentum of recent days has culminated. The size of the downside move corresponded exactly to the height of the previous blue consolidation aka sideways trend. After the lower border of the blue formation on the right has been reached and temporarily breached, an upward reversal followed on Tuesday.
The upswing hasn't been accompanied by any buy signals from the daily indicators, however. It increases the probability of one more downswing and a test of the 38.2% Fibonacci retracement in the coming days.


