
Sino-US Trade Talks Keep Invigorating The Risk Rally

The State of Affairs in Financial Markets — Jan 21
The unambiguous ‘risk on’ profile keeps on going with no end in sight so long as the US and China continue to signal that a more protracted trade deal is in the making or we get evidence that supply is returning back into the equity markets. We imagine the Fed Put is undoubtedly also working it magic too.
The offer by China to reduce the trade surplus to the US to zero by 2024 was enough for risk-seeking strategies to perform exceptionally well, even if significant uncertainties still remain as the US maintains its hardline stance by demanding more ambitious concessions if a deal is to be sealed. For instance, the US is looking to reduce the trade deficit it has with China over 2y.
For now, the net result is clear, as the bellwether for equities (ES) jumped by over 1.5% led by Industrial Goods with Technology also faring well.
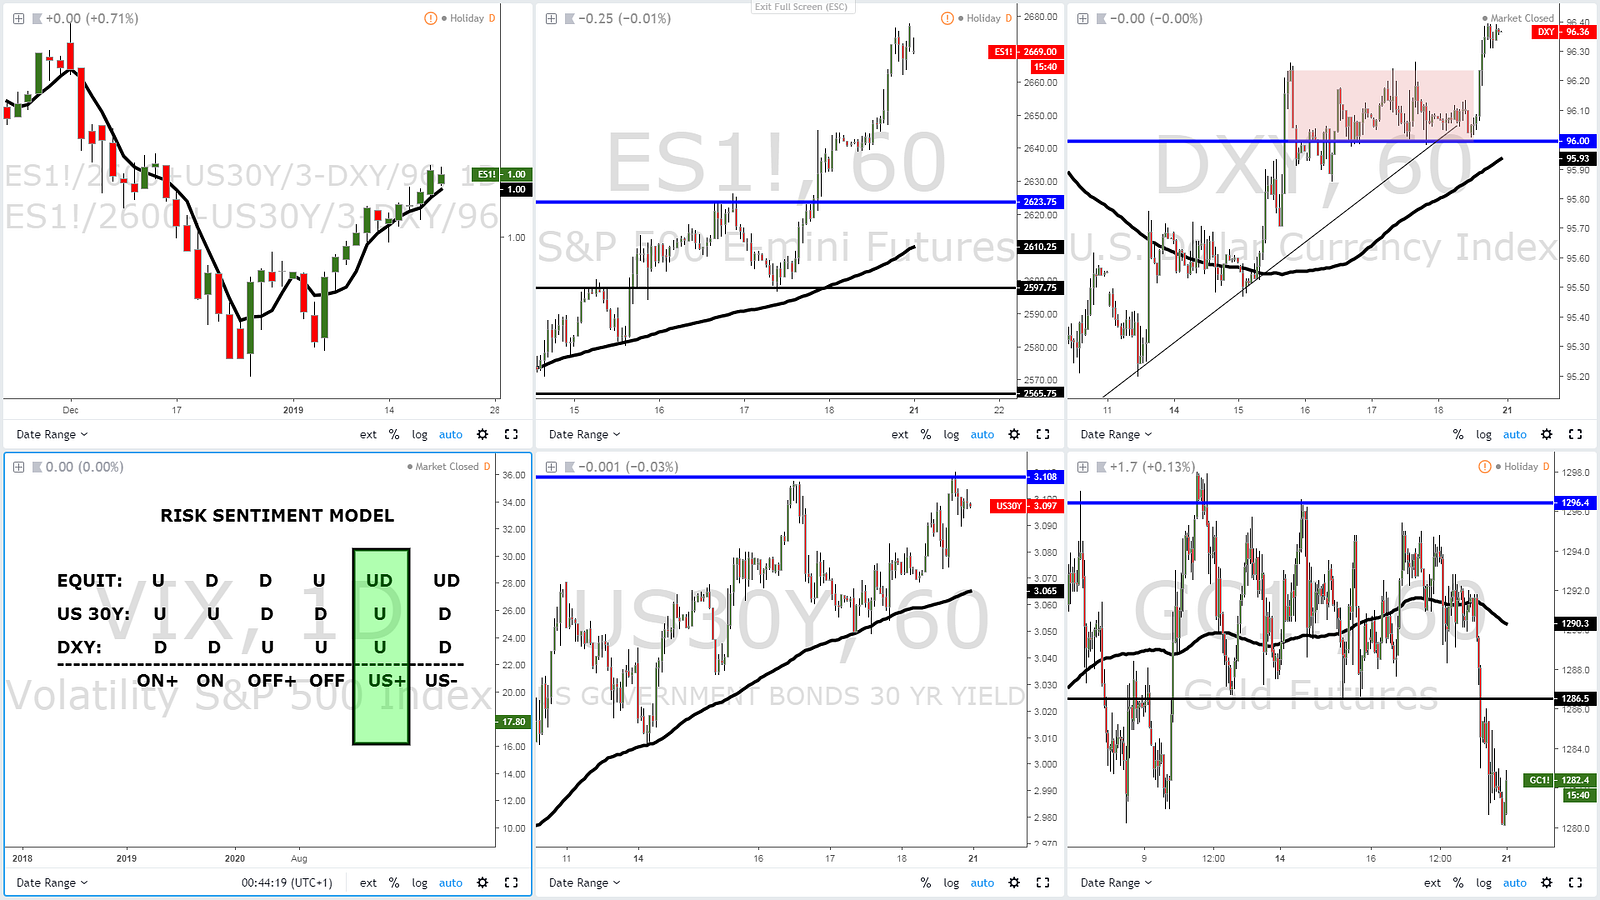
The ebullient mood received an accelerant by higher yields in the US fixed income market, where the US 30-year bond rate is now retesting 3.1% daily resistance as flows head back into riskier bets (equities). The US Dollar, against conventional belief, is also riding higher on the risk-friendly mode, as the Euro and the Chinese Yuan trade on the backfoot.
It’s worth noting that the renewed momentum in the USD, technically speaking, allows further upside leeway after the breakout of a 1-week long range in the DXY. The break lower in Gold also solidifies the outlook for the USD short-term, an important development to strengthen the ‘risk-on’ tone.
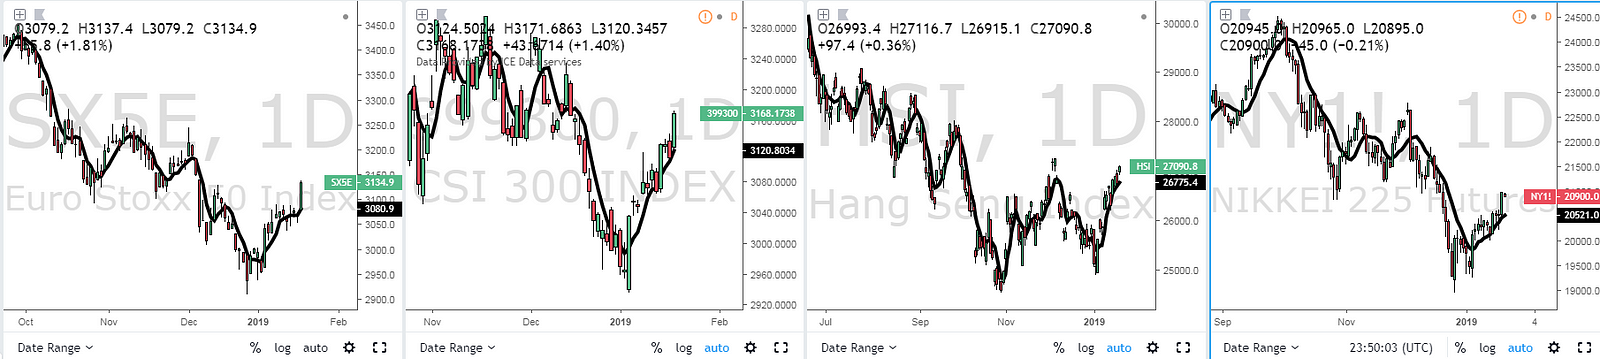
Interestingly, the improved sentiment has been spreading into the broader market spectrum, with equity investors returning with a higher degree on confidence into international markets such as the Euro Stoxx 50, China’s CSI 300, Hang Seng, Nikkei to name a few, all rising with vigor as the market keeps discounting the removal of the Chinese tariffs by the US in return to more reciprocal and fair trade conditions. What’s more, the renewed commitment by the Chinese government to flood the system with additional liquidity via fiscal and monetary easing is also underpinning the risk profile.
The conditions heading into Monday, therefore, qualify as a USD strength environment within a risk appetite context. All eyes will now be fixated in the Chinese data due at 2 GMT (GDP, Asset Investment, Ind Prod). With the US on holidays due to Martin Luther King commemoration and the US government shutdown prolonged further, it’s quite likely that the outcome from China will set the tone for the rest of the day.
Chart Insights — Trading Opportunities
EUR/USD — Bearish Resolution Through Range POC
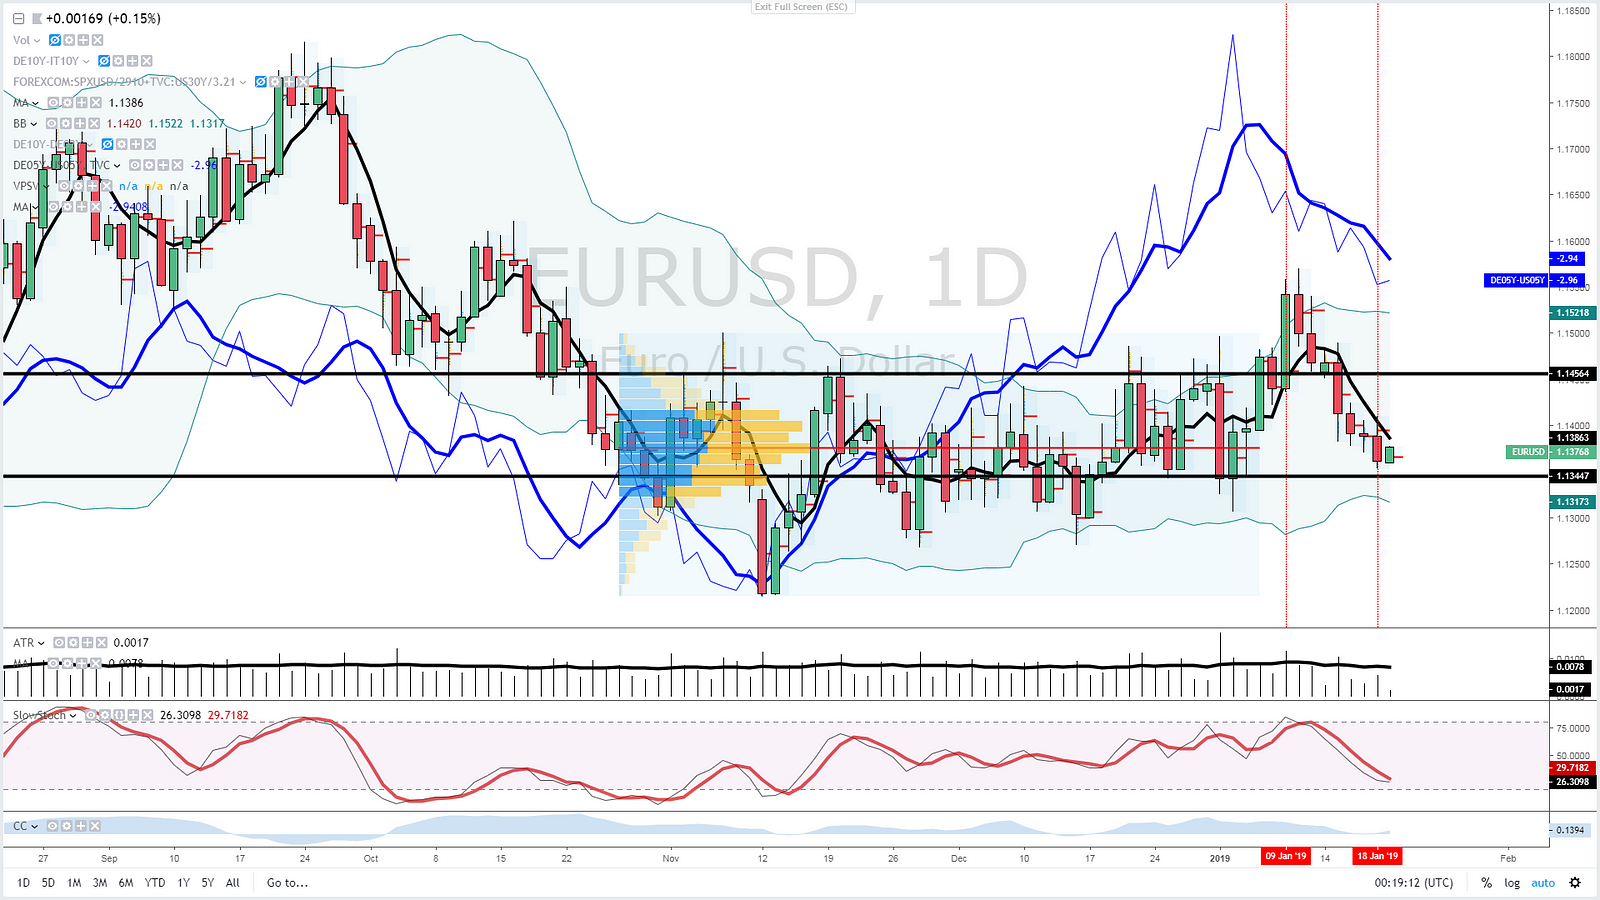
The heightened risk appetite seems to have encouraged the market to return into the carry trade via lower-yielding currencies the likes of the Euro and the Yen. The weakness in the former has manifested into the breakout of its multi-month range point of control circa 1.1375, which allows further downside towards 1.1345–50, an area of dual support based on the tests from late last year. The continuation of the downward pressures has the backing of a bearish 5-DMA, alongside the short-term momentum in the German vs US bond yield spread. Even if the macro bond yield spread divergence is still present for all to see, there is no price action evidence that suggests the market is looking to turn around as of today, hence one must be cautious.
USD/JPY — Bullish Bias With A Major Obstacle Nearby
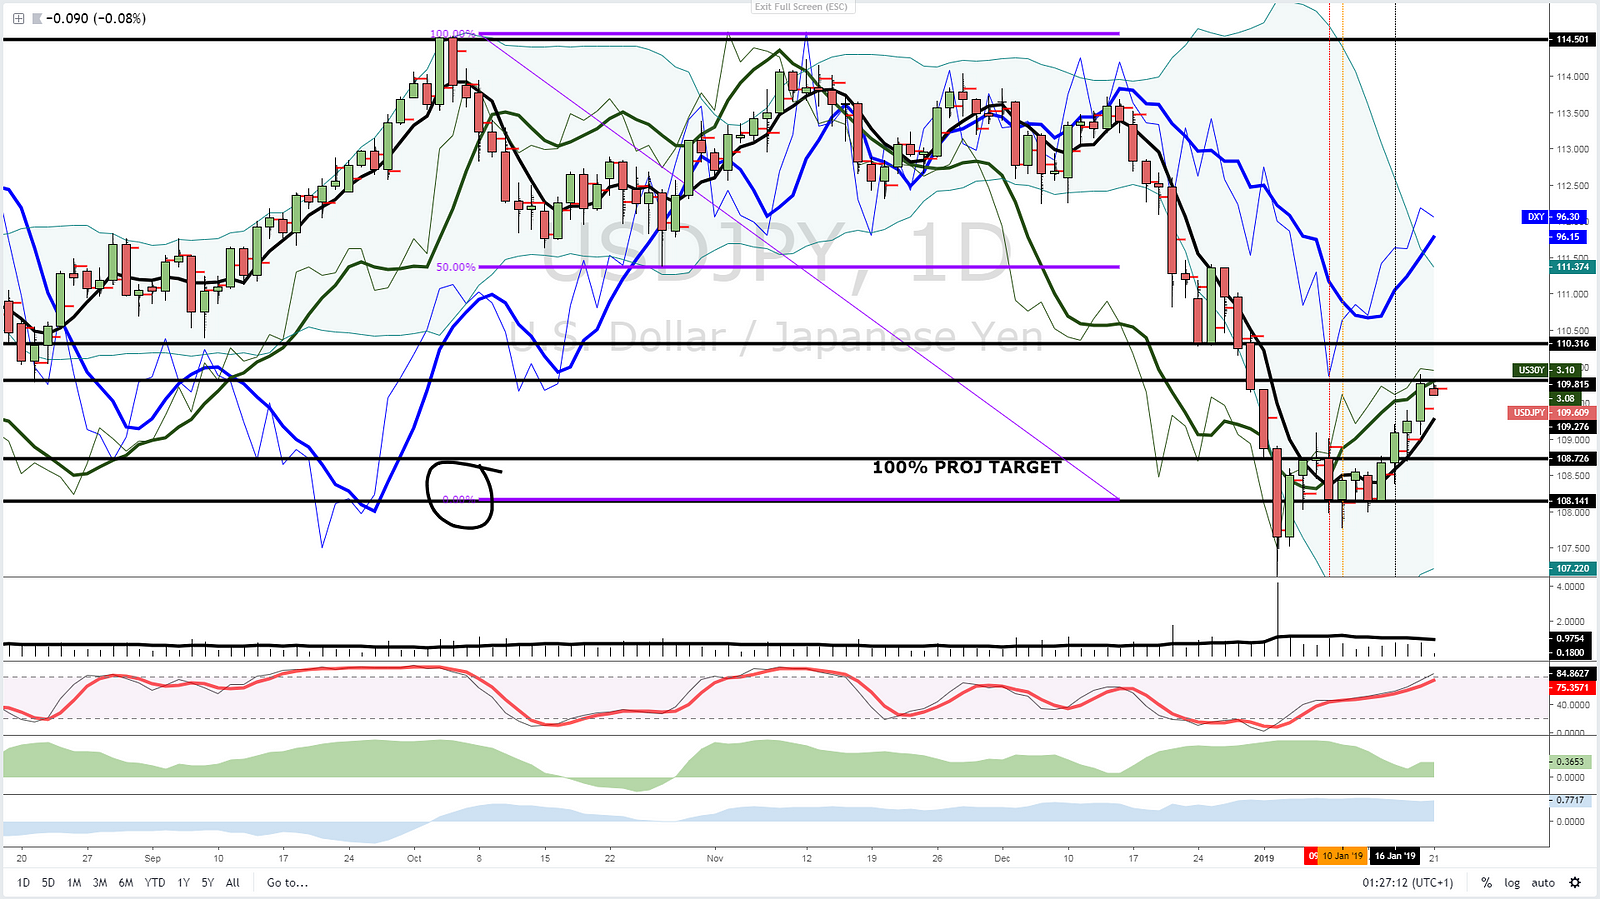
The relatively easier gains in the pair have been made and it should get much harder to make progress from here on out even if the signals via the DXY and US fixed income continue to support the buying on dips campaigns based on the universal 5-DMA upward slopes we are seeing. The acceleration from Friday stopped on its tracks around the 109.80, with the close unable to achieve any higher levels. This is significant as the level coincides with the backtest of a major swing low from back in Aug 21st now turned resistance.
AUD/USD — Tricky As Risk On Hints Dip Buying
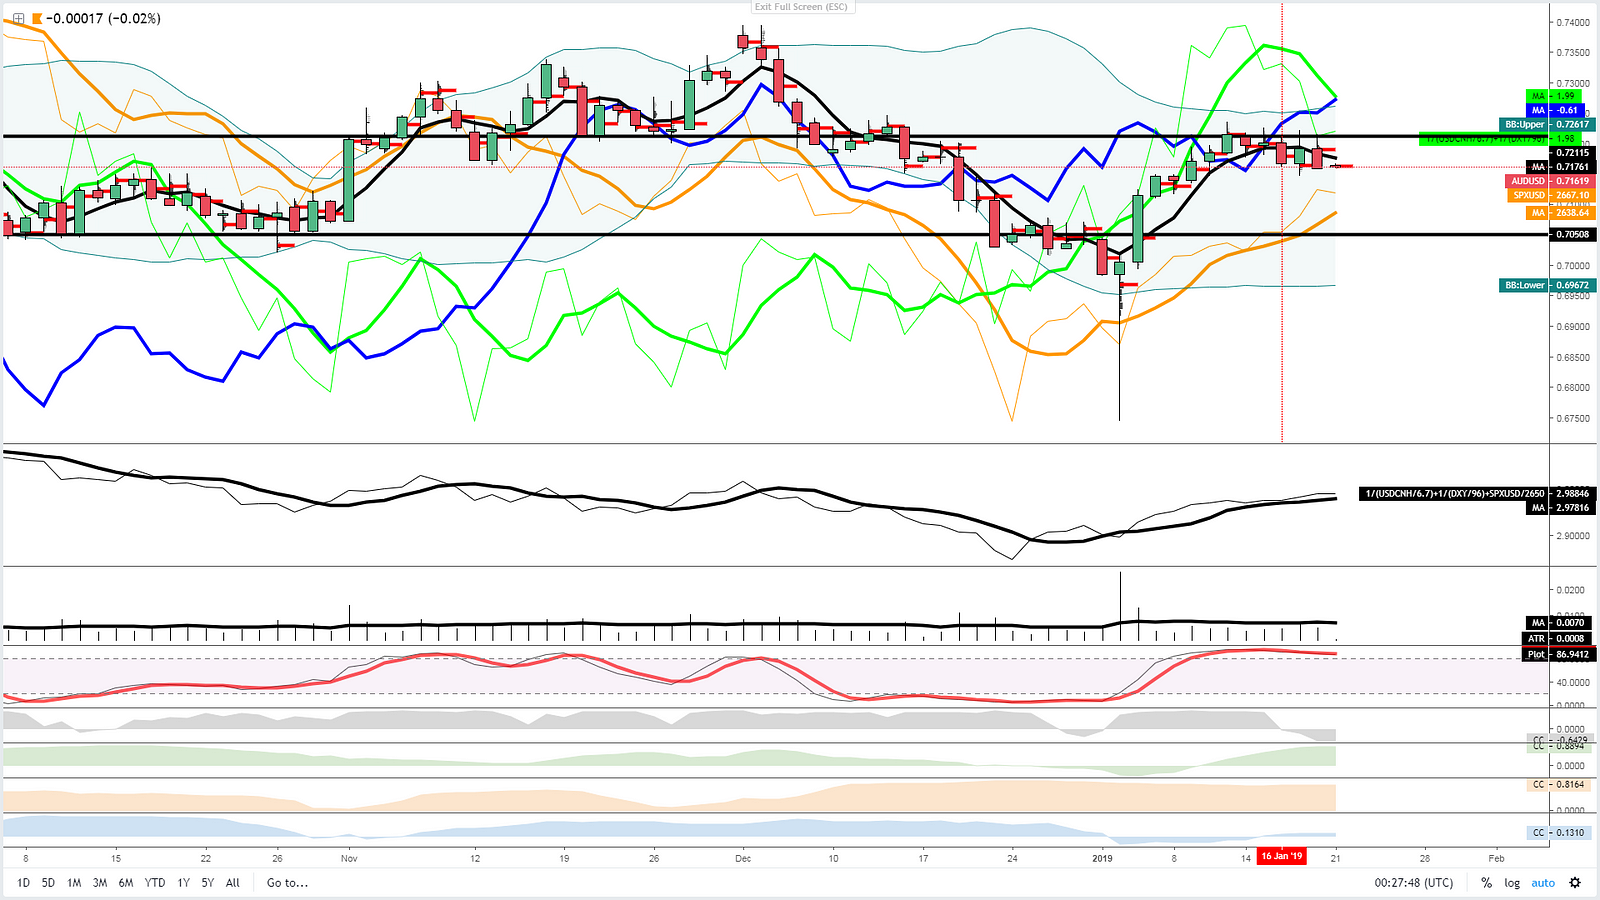
The bias for the Aussie is far from clear, as we are getting contradictory signals. The strength via the DXY is keeping the sell-side pressure alive, while the buoyant risk on appetite as depicted by the 5-DMA upward slope in the S&P 500 (orange line), alongside a higher Aus vs US bond yield spread (blue), should limit the downside as strong dip buying is likely to be quite active under this environment. Throughout last week, it became clear that 0.72/7210 is a major selling stronghold, capping the price from making further progress for the last 6 days in a row, even as the China-US trade talks are heading in the right direction. Should the US Dollar keeps its strength intact and the risk debilitate, that would be music to the ears of sellers.
Like What You See?
Soon you will be able to subscribe to receive ‘the daily edge’. In the meantime, feel free to follow Ivan on Twitter.
Important Footnotes
- Risk model: The fact that financial markets have become so intertwined and dynamic makes it essential to stay constantly in tune with market conditions and adapt to new environments. This prop model will assist you to gauge the context that you are trading so that you can significantly reduce the downside risks. To understand the principles applied in the assessment of this model, refer to the tutorial How to Unpack Risk Sentiment Profiles
- Cycles: Markets evolve in cycles followed by a period of distribution and/or accumulation. The weekly cycles are highlighted in red, blue refers to the daily, while the black lines represent the hourly cycles. To understand the principles applied in the assessment of cycles, refer to the tutorial How To Read Market Structures In Forex
- POC: It refers to the point of control. It represents the areas of most interest by trading volume and should act as walls of bids/offers that may result in price reversals. The volume profile analysis tracks trading activity over a specified time period at specified price levels. The study reveals the constant evolution of the market auction process. If you wish to find out more about the importance of the POC, refer to the tutorial How to Read Volume Profile Structures
- Tick Volume: Price updates activity provides great insights into the actual buy or sell-side commitment to be engaged into a specific directional movement. Studies validate that price updates (tick volume) are highly correlated to actual traded volume, with the correlation being very high, when looking at hourly data. If you wish to find out more about the importance tick volume, refer to the tutorial on Why Is Tick Volume Important To Monitor?
- Horizontal Support/Resistance: Unlike levels of dynamic support or resistance or more subjective measurements such as fibonacci retracements, pivot points, trendlines, or other forms of reactive areas, the horizontal lines of support and resistance are universal concepts used by the majority of market participants. It, therefore, makes the areas the most widely followed and relevant to monitor. The Ultimate Guide To Identify Areas Of High Interest In Any Market
- Trendlines: Besides the horizontal lines, trendlines are helpful as a visual representation of the trend. The trendlines are drawn respecting a series of rules that determine the validation of a new cycle being created. Therefore, these trendline drawn in the chart hinge to a certain interpretation of market structures.
- Correlations: Each forex pair has a series of highly correlated assets to assess valuations. This type of study is called inter-market analysis and it involves scoping out anomalies in the ever-evolving global interconnectivity between equities, bonds, currencies, and commodities. If you would like to understand more about this concept, refer to the tutorial How Divergence In Correlated Assets Can Help You Add An Edge.
- Fundamentals: It’s important to highlight that the daily market outlook provided in this report is subject to the impact of the fundamental news. Any unexpected news may cause the price to behave erratically in the short term.
- Projection Targets: The usefulness of the 100% projection resides in the symmetry and harmonic relationships of market cycles. By drawing a 100% projection, you can anticipate the area in the chart where some type of pause and potential reversals in price is likely to occur, due to 1. The side in control of the cycle takes profits 2. Counter-trend positions are added by contrarian players 3. These are price points where limit orders are set by market-makers. You can find out more by reading the tutorial on The Magical 100% Fibonacci Projection
The Daily Edge is authored by Ivan Delgado, Head of Market Research at Global Prime. The purpose of this content is to provide an assessment of the market conditions. The report takes an in-depth ...
more

