
Silver Chartbook At Week's End – Bullish Tone But Not Low Risk
Bullish tone but not low risk
Silver has shown some relative weakness towards gold within the precious metal sector in recent days. Looking at the weekly chart we can see that the distribution zone near US$18.60 has successfully rejected silver prices a second time within the last six months. Silver is trading right in the center of the sideways contracting trading range between US$16.60 and US$18.60. Yes, we have a bullish tone however there is not a low-risk setup. We would need prices at a different price level to enter for an acceptable risk into this precious metal.
Silver in US Dollar (weekly chart) – Contracting range with bullish tone:
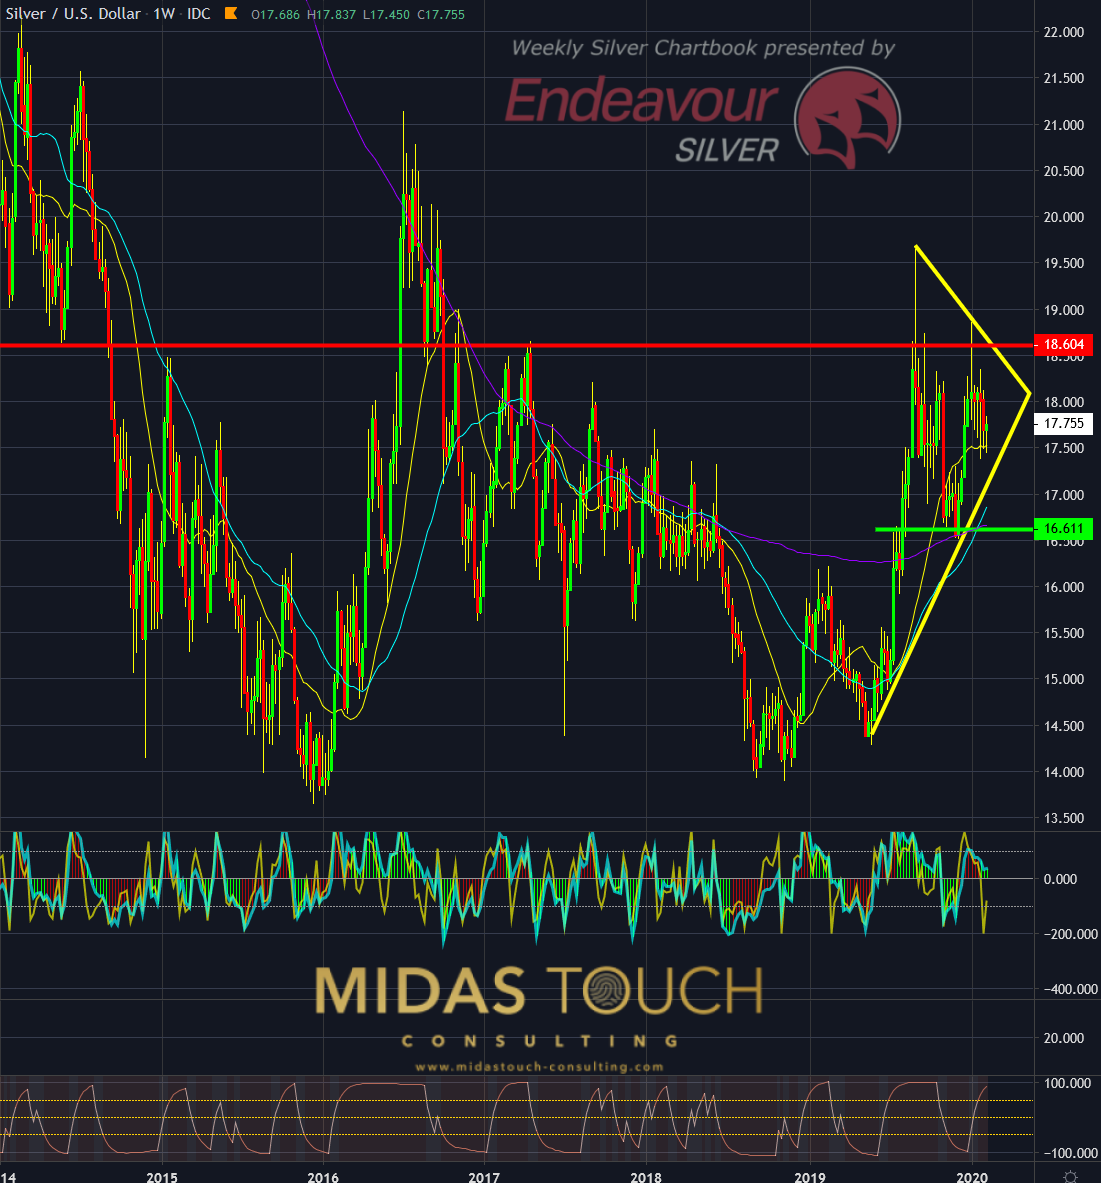
Silver in US Dollar, weekly chart as of February 14th, 2020
With prices trading in the middle of the sideways range, marked with the green and red horizontal support and resistance lines, we are trading at a sub-par entry zone. Yellow triangle lines show the range contracting and as such a possible continuation pattern to the upside.
Silver daily Chart – Possible triangle break :
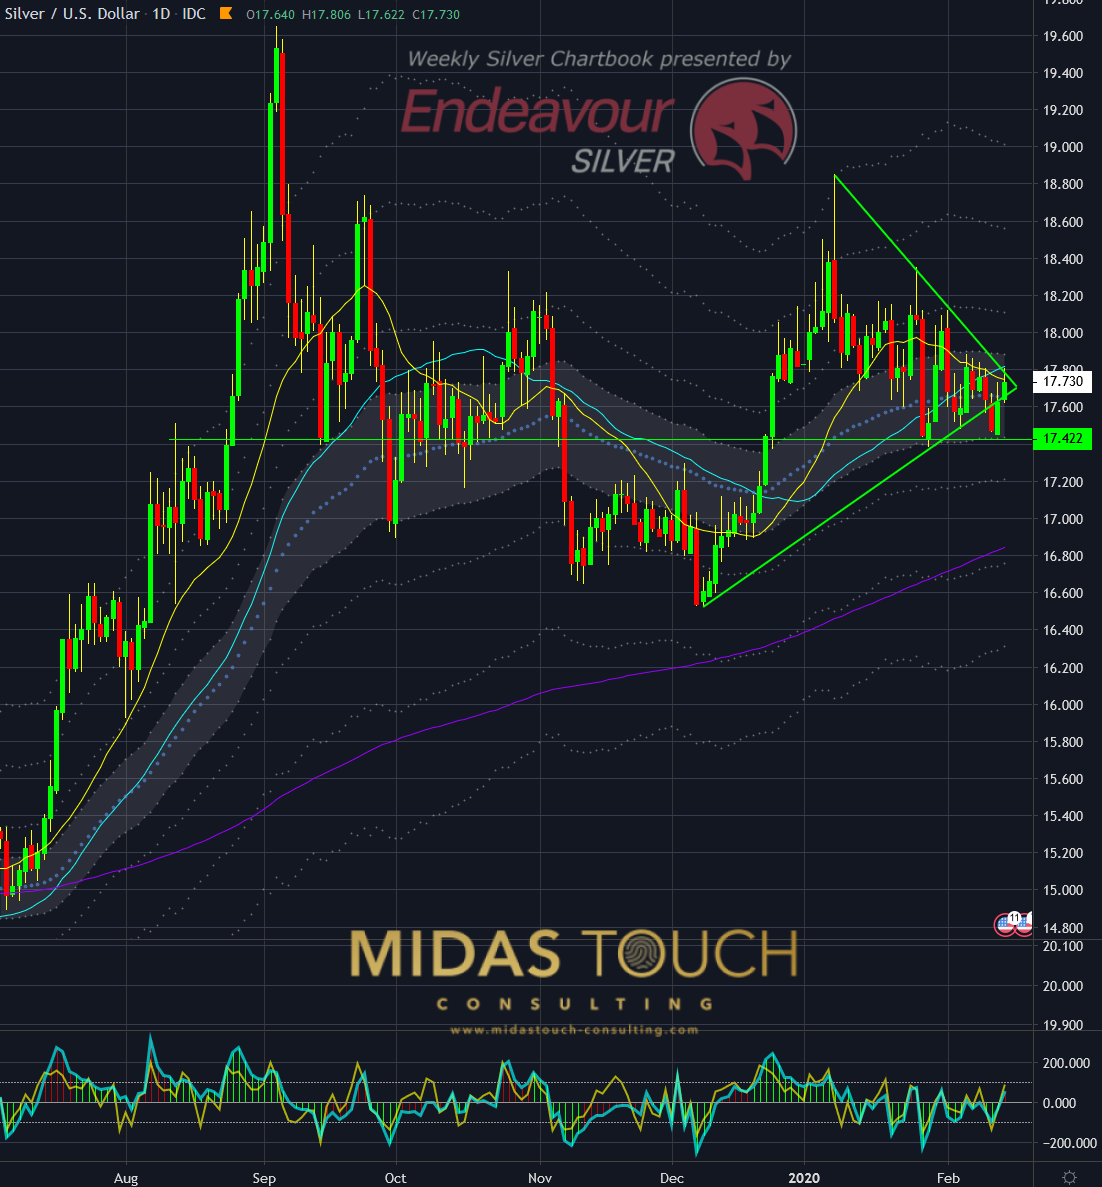
Silver in US Dollar, daily chart as of February 14th, 2020
The daily chart provides mixed signals as well. On the one side an attempt to break the triangle formation to the downside, on the other hand, a successful support bounce. With larger time frames usually dominating lower ones, we see no sensible entry here. This especially before a weekend, representing “sitting duck” to news and additional risk as such. As much as the bullish tone overall is clear, this is simply not an entry zone for the risk-averse participant.
Disclosure: None.


