
Renko Price Action Of EURUSD, Gold, USDJPY And The Dollar Index
The EURUSD looks somewhat weaker to the downside, while USDJPY and the Dollar index remain non-committal to a trend. On the other hand we have gold, which is setting up into a bullish move. But will things change as we head into the end of the second quarter of 2021? There are a lot of economic events lined up in the latter part of the week.
Read the detailed summary and also key factors to watch in the markets this week.
EURUSD Outlook: Will the bearish pennant trigger further downside?
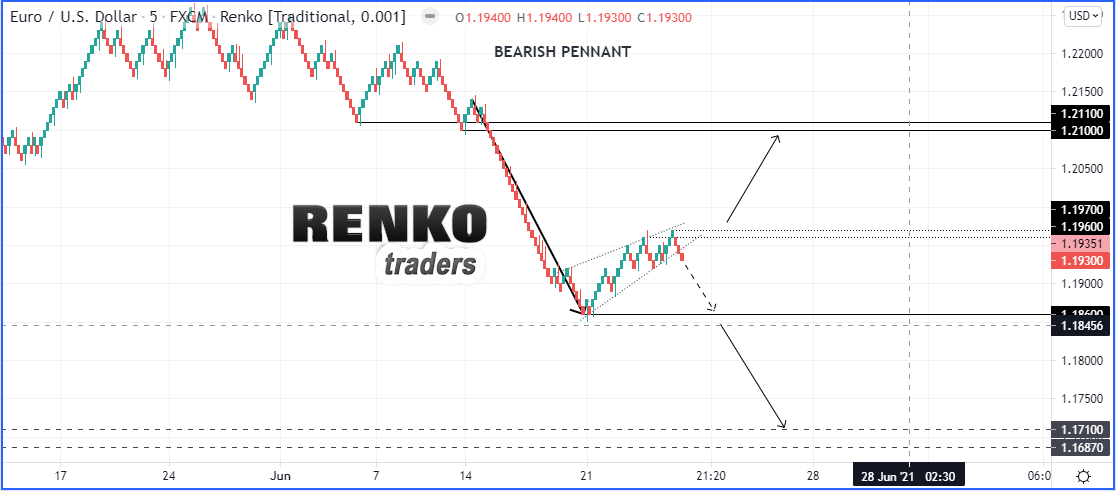
The EURUSD chart is quite clear, in that we notice a sharp decline in prices after the euro lost the 1.211 – 1.2100 handle. The question is whether there will be a follow through to this price action.
If the EURUSD moves as expected, we could see further declines in the making, with the still nascent downtrend firmly taking shape.
Following this break down of the 1.211 – 1.210, the sharp decline saw prices hitting a bottom at 1.186.
We now see a consolidation taking shape.
Price action in the EURUSD has been making gradual higher highs and higher lows. Yet, the shape of the consolidation is similar to a bearish pennant pattern. (A bearish pennant pattern is a temporary consolidation in a downtrend. Obviously, depending on the direction of the breakout, the pattern is validated.)
Given the current EURUSD price action, we need to see evidence of prices moving lower. We already notice price closing out slightly lower on Friday, June 25, 2021. But a continuation to the downside is required to confirm this view on the EURUSD.
The initial downside will be seen at the 1.1860 handle. And a successful breakout below this low will put the minimum downside in the EURUSD to 1.1687. But we expect prices to stall after reaching 1.1710.
Invalidating this bearish view will be a move above 1.1967. A firm close above this level will clearly invalidate the bearish pennant pattern. This will in turn set the stage for a retracement to the downtrend.
We may expect to see price moving as much as 1.2033, marking the 61.8% Fibonacci retracement from the 1.214 - 1.186 leg. The main resistance level at 1.211 – 1.210 will of course be the prime target.
Gold price shaping into an ascending triangle
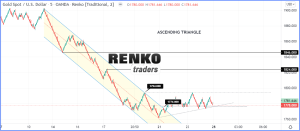
Gold prices have settled into a sideways range after touching down to the lows of 1762. Since then, price action has been moving choppy.
This comes after a sustained decline in prices. Gold prices have been posting steady declines since hitting a top at 1902. Consequently, XAUUSD settled into a steady downtrend channel. Quite recently, gold prices managed to breakout from this falling price channel, setting up expectations for a possible reversal.
However, it seems like the markets are still not decided. There is a clear interim top formed near the 1794 area. Being tested twice and failing so far. Meanwhile, XAUUSD has been consistently making higher lows off the 1762 level.
This has morphed into an ascending triangle pattern. (The ascending triangle pattern is identified by a strong resistance level being tested at least twice. Meanwhile, the following lows tend to be higher than the previous lows.)
This opens up an interesting view as to whether gold prices may be preparing for a breakout.
In order for the upside to be validated, gold prices need to clearly rise above the 1794 level, validating the ascending triangle pattern. In this scenario, there is scope for price to rise toward the 1824 level, followed by 1846.
However, the ascending triangle pattern remains fragile, with the possibility for prices to breakdown. Hence, watch the 1774 level. A sustained decline below this level (with lower highs) could signal continuation to the downside.
The immediate downside target remains near the 1762 handle. But we cannot rule out further declines if this level breaches.
USDJPY shifts to a falling price channel
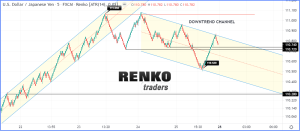
The USDJPY is currently settled within a falling price channel. This comes right off the bat after a rather prolonged rising price channel.
But comparatively, the breadth of the price channel is much wider comparing to the previous rising price channel. This could possibly suggest consolidation taking place.
The USDJPY markets are still not decided whether to push higher or lower. Still, the current set up signals possible clues. As it stands, the USDJPY price action is nearing the 110.74 – 110.72 area of support/resistance.
As long as this support holds, we may get to see USDJPY rebounding higher or falling toward the previous lows at 110.52. In all aspects, it is likely that if USDJPY falls below 110.74 – 110.72, then this level may be retested again.
This scenario will no doubt validate the downside bias.
Below the 110.52 lows, the next key target for the USDJPY remains near the 110.28 level. It is quite likely that the amount of time it takes to hit this target may span over a few weeks, if not a month or two.
To the upside, is the 110.74 – 110.72 holds, then watch for price to breakout from the previous highs of 110.96. But even despite this, USDJPY will need to break past the recent highs at 111.06.
Given the current set up, this scenario looks unlikely.
The Dollar Index (DXY) – Does the failed bullish flag hold clues?
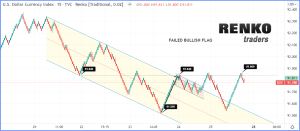
The U.S. dollar index forms the last piece to this puzzle. Looking at the chart, one can clearly see the downtrend that prices are in.
Interestingly, the recent moves to the upside saw prices forming a bullish flag pattern. A bullish flag pattern, forming near the bottom could signal a trend reversal if validated.
However, this was not the case for the Dollar index. Instead, we noticed a fake breakout followed by a sharp decline. For the moment, prices remain trading flat, with the resistance area near 91.84 holding out.
Therefore, a breakout above 91.84 could confirm the upside bias. It may also evince a bullish sentiment on the US dollar.
But the price level near 91.84 is strong, for the fact that it also acted as support level just recently, within the falling price channel. With this level capped, it would take a strong momentum to break past this level.
This potentially leaves us with a sideways range in the dollar index. The previous lows near 91.52 remains strong for the moment. Therefore, watch for the upside breakout. A close above the recent highs of 91.86 could trigger further gains.
Upcoming Market Events that could move the markets
We are heading into the end of the month and the quarter. Therefore, there is a strong chance for position squaring, which may lead to a dollar weakness in the markets. However, this is likely to be temporary.
Right around the corner of the month end, markets prepare for the June payrolls report. What we will see is a week that will start out quietly and gain momentum into the Friday July 2nd payrolls report.
- Fed members (Williams, Barkin) are due to set the ball rolling with their speeches amid a broadly quiet start to the week
- On Wednesday, June 30, the Eurozone flash inflation estimates are due followed by the ADP private payrolls report. Estimates show a 1.9% annual increase in inflation (estimated). This marks a slightly slower pace of increase comparing to the 2% rate in May. A slowdown in the Eurozone inflation may increase the possibility for continued divergence between the US and EU inflation expectations.
- ADP private payrolls report should create a temporary boost. Current estimates are for 555k jobs for June, down from 978k previously
- Thursday morning will see the markets warming up to the quarterly Tankan reports from the BoJ. Estimates show a resurgence in the respective indices.
- Later on Thursday, the NY session will open to the ISM manufacturing index report. Manufacturing PMI is expected to ease from 61.2 to 61.0. If the report is inline with the expectations, we don't expect to see much movement. But a miss on the estimates to the downside could signal some short term USD weakness.
- Friday is where all the action happens. The ECB president Lagarde takes stage at the same time as the release of the monthly NFP or payrolls report. This should provide fodder for a lot of market movement.
- As far as the payrolls report go, the US unemployment rate is set to to 5.7%, down from 5.8% earlier. The payrolls are expected to rise from 559k to 700k in June.
- Markets may look to the wage growth report, which is forecast to rise just 0.4%, down from 0.5% in May. Given that inflation is running hot, a weaker pace of wage growth will require some smart maneuvering from the Fed.
Disclaimer: The views and opinions expressed in this article are not to be considered as investment advice. The technical outlook article is only for educational purposes.
Disclosure: I/We do ...
more

