
NZD/USD Technical Setup: Price Action Approaches Key Support
The NZD/USD pair has been suppressed for a while now but approaches a rather key level of support (0.6200) once again. This presents an interesting dilemma of a possible bounce of breakdown. Chartists will tell you that the more frequently a level is tested and respected, the more likely it is to eventually give way. Thus far, the pair has approached 0.6200 and the 61.8% Fib of the March 2020 major move without continued downside momentum.
Fundamental factors supporting another bounce off the 0.6200 level include China’s supportive monetary policy amid scattered lockdowns and slower growth. Nevertheless, IMF forecast China to recover faster than the US into 2023 which bodes well for the Kiwi as China is new Zealand’s largest trading partner. Looking at the US dollar, we have already seen yields drop and market expectations around the Fed’s terminal rate appears to have peaked last week, around 4%. Concerning earnings projections, slower growth and declining consumer sentiment in the US could result in a softer dollar as recession fears gain momentum. Nearest resistance appears at 0.6395 if we are to witness a rejection of lower prices around key support.
However, if USD data moderates, resulting in lower market expectations around a possible near-term recession, the existing downtrend could continue. In the event of a breakdown of 0.6200, support comes in all the way down at 0.5915 – which corresponds with the 2004 and 2006 major pivot point.
NZD/USD Daily Chart
(Click on image to enlarge)
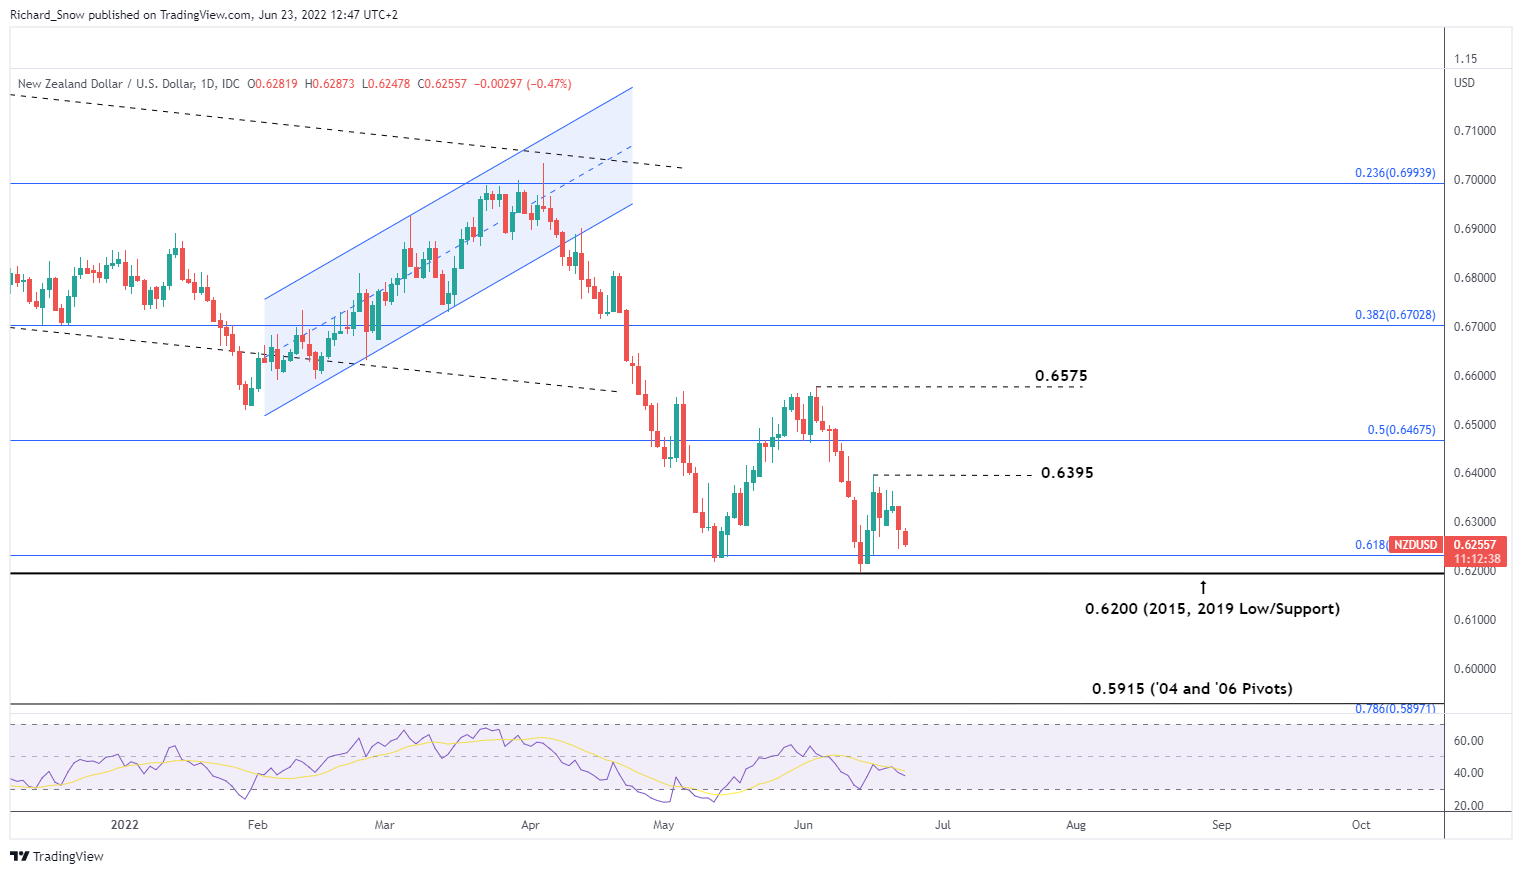
Source: TradingView, prepared by Richard Snow
The monthly chart highlights the 2020 major move and subsequent Fibonacci levels. The 61.8% Fib appears alongside the long-term pivot point around 0.6200, establishing a rather significant zone of support.
NZD/USD Monthly Chart
(Click on image to enlarge)
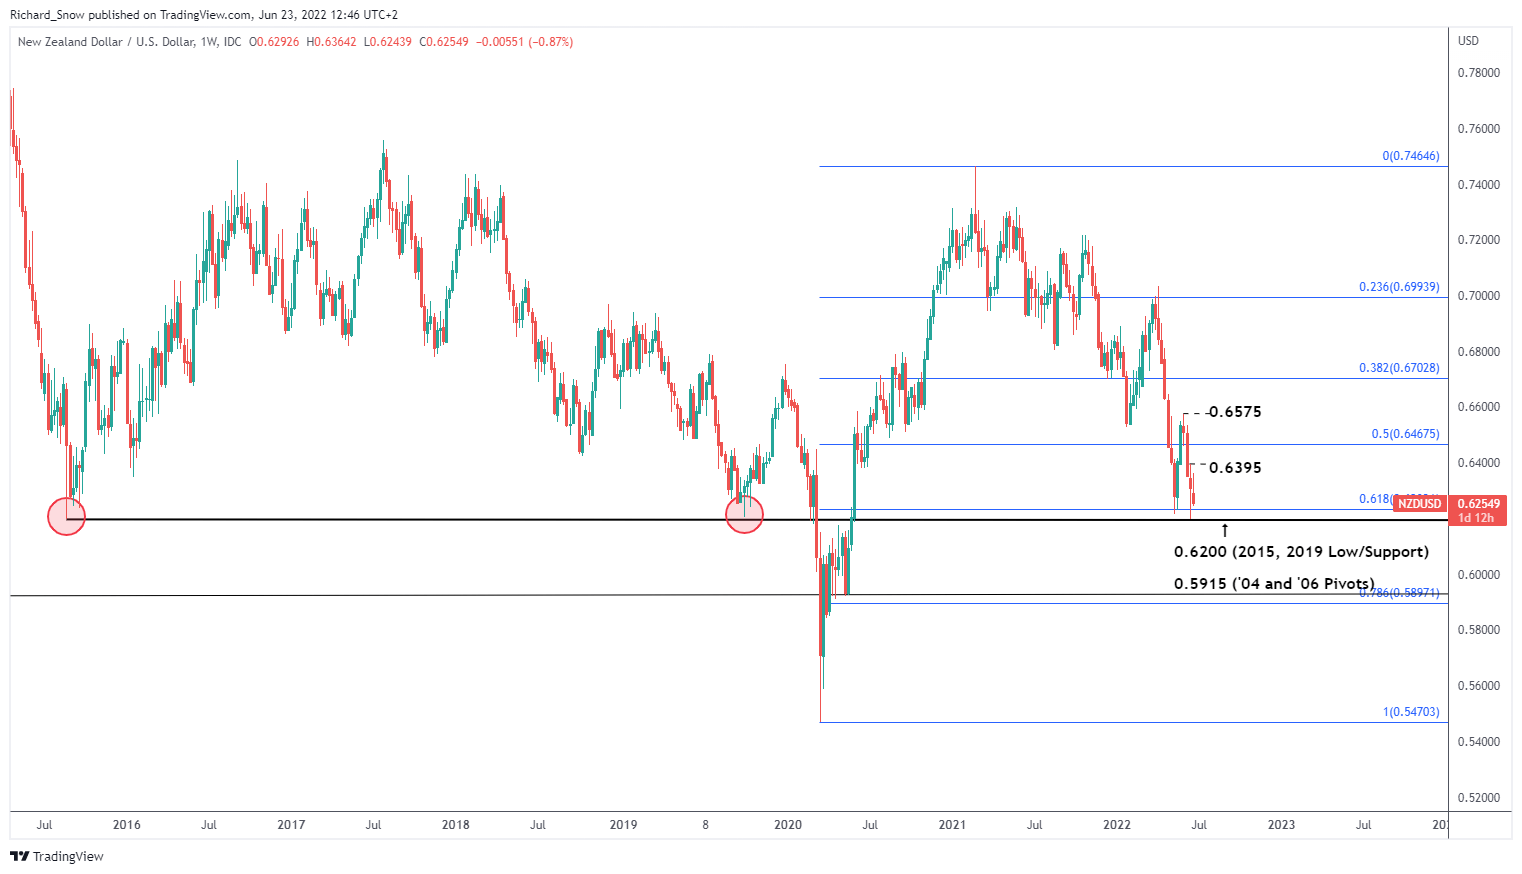
Source: TradingView, prepared by Richard Snow
NZD/USD:Retail trader data shows 65.55% of traders are net-long with the ratio of traders long to short at 1.90 to 1.
We typically take a contrarian view to crowd sentiment, and the fact traders are net-long suggests NZD/USD prices may continue to fall.
The number of traders net-long is 3.63% higher than yesterday and 0.63% lower from last week, while the number of traders net-short is 12.70% lower than yesterday and 14.58% higher from last week.
Positioning is more net-long than yesterday but less net-long from last week. The combination of current sentiment and recent changes gives us a further mixed NZD/USD trading outlook.
The RBZN is still expected to hike rates rather aggressively, continuing on July the 13th where 50 bps is currently priced in by the markets. Markets currently see just short of 200bps of further tightening in the year which would place the target rate at 4%.
Market Implied Probabilities of NZD Target Rate
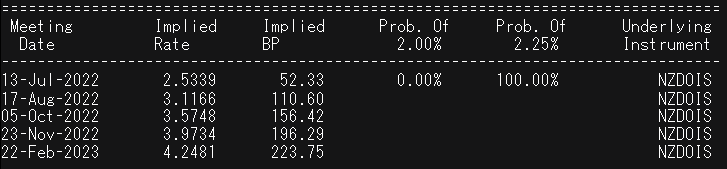
Source: Refinitiv
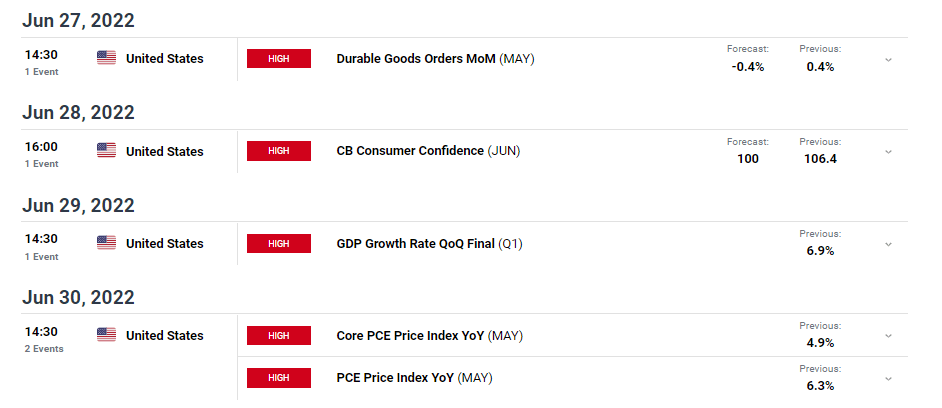
Major Risk Events in the next 7 Days
Scheduled risk events are dominated by the US in the coming days. Next week we see the final US GDP print which is likely to confirm a Q1 contraction. Growth is a major concern right now as the Fed appears set to hike aggressively despite warnings about the state of the consumer and slowing economic growth. Then next Thursday we have PCE data – something that Jerome Powell mentioned still has a fair way to go despite easing slightly in recent prints.
Disclosure: See the full disclosure for DailyFX here.


