
How Resistance Levels Are Central Factor In Today's Forex Market
EUR/USD
4 hour
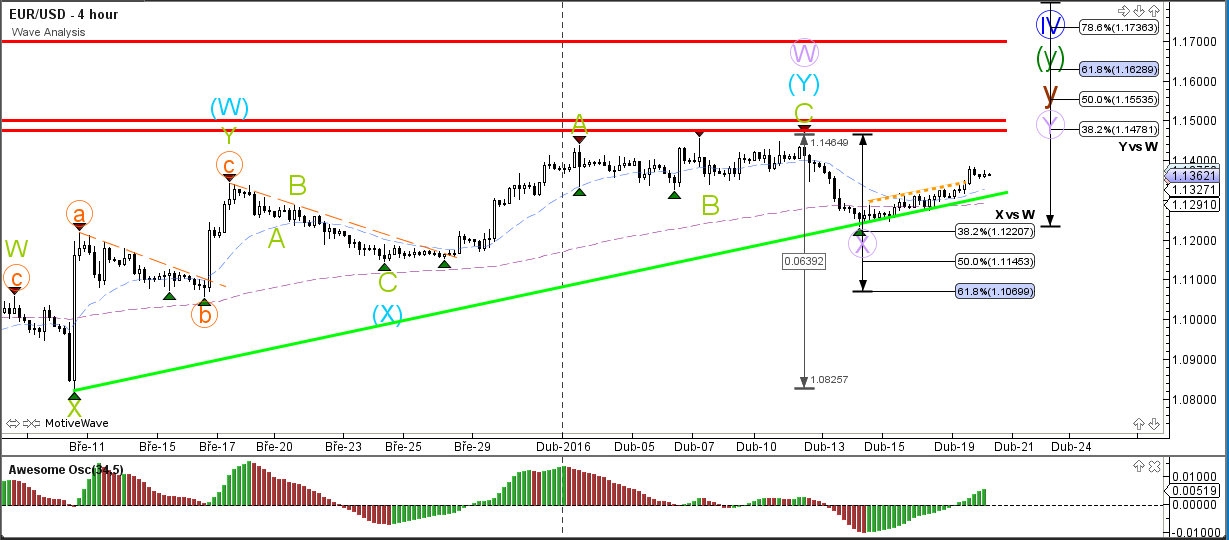
The EUR/USD did not break below support (green) and in fact broke the resistance line (dotted orange). This increases the chance that the bearish price action was a retracement for a wave X (purple) which respected the 38.2% Fibonacci level.
1 hour
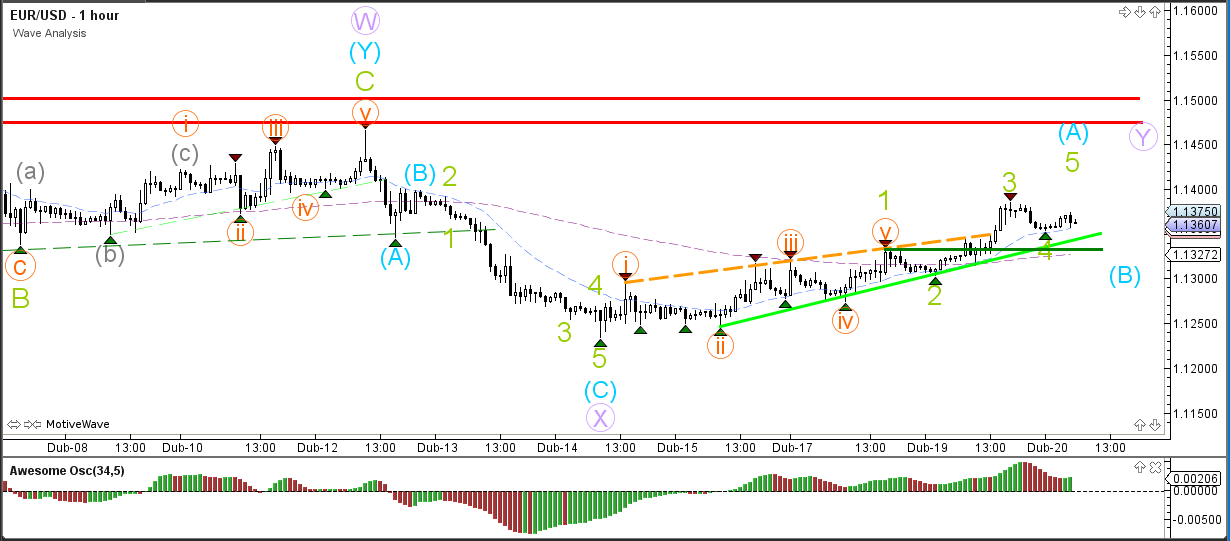
The EUR/USD price action remains choppy and corrective. A break below the 2 support trend lines (green) invalidates the 4th wave (green).
GBP/USD
4 hour
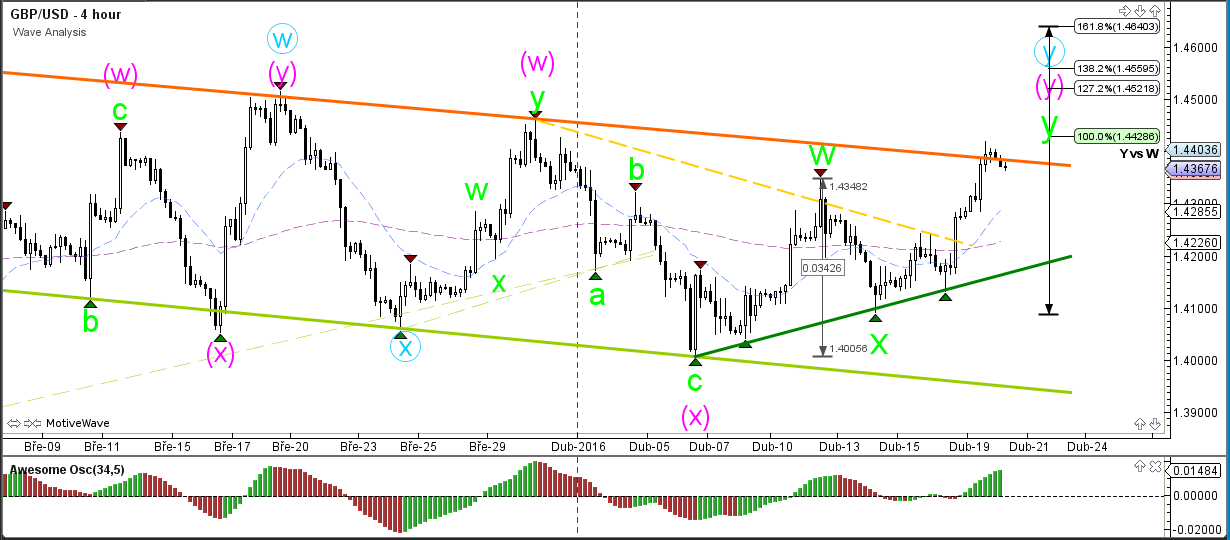
After making a bullish break above the contracting triangle (dotted yellow) chart pattern, the GBP/USD has reached the resistance trend line (orange) and 100% Fibonacci target, which could be a bounce or break spot.
1 hour

When analyzing the lower time frames, the GBP/USD could have one more bullish push remaining via a wave 5 (grey). A break below the 50% or 61.8% Fibonacci retracement level would make such a wave 4 (grey) unlikely.
USD/JPY
4 hour
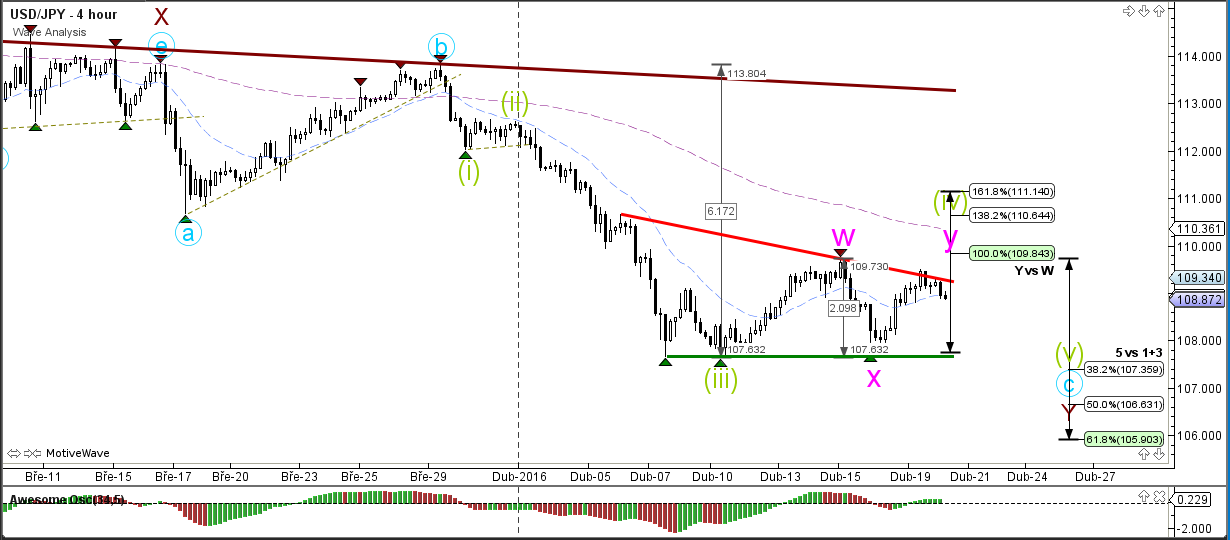
The USD/JPY has reached resistance (red) but is unable to break above it. A bearish turn could confirm the expansion of a wave 4 (green) correction via WXY (pink).
1 hour
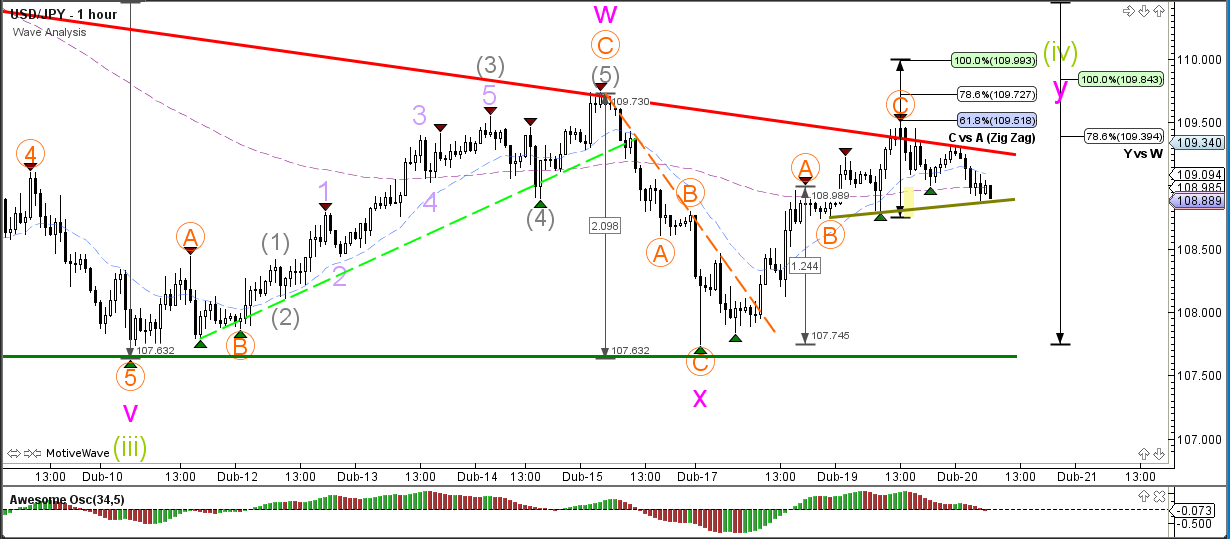
The USD/JPY is building a mini triangle at the resistance trend line (red). A break below the support (green) of the triangle could indicate the completion of the bullish ABC (orange) zigzag.
Disclosure: None.


