
Gold Price Forecast: XAU/USD Cheers Dollar Dumping, Closes In On $2000
- Gold bulls unstoppable, as the US dollar keeps falling.
- Rallying Treasury yields fail to limit gold’s upside.
- Eyes on US ISM Manufacturing PMI and Employment sub-index.
Gold (XAU/USD) hit the highest levels in two weeks near the $1990 mark, as the bulls remain unstoppable, courtesy of the relentless declines in the US dollar across its main competitors. The yieldless gold continues to benefit from expectations of a low-interest-rate environment for a prolonged period in the aftermath of the Fed Chair Powell’s speech. The yellow metal finally dived out of the eight-day-long range above the $1977 hurdle, as it looks to regain the $2000 threshold.
The bullish tone in gold is also backed by the weak performance in the Asian equities following a softer close on Wall Street overnight. The continued rise in the coronavirus cases globally overwhelm the markets. Looking ahead, only a better-than-expected US ISM Manufacturing PMI and Employment sub-index could come to the rescue of the dollar bulls,
Gold: Hourly chart
Short-term technical perspective
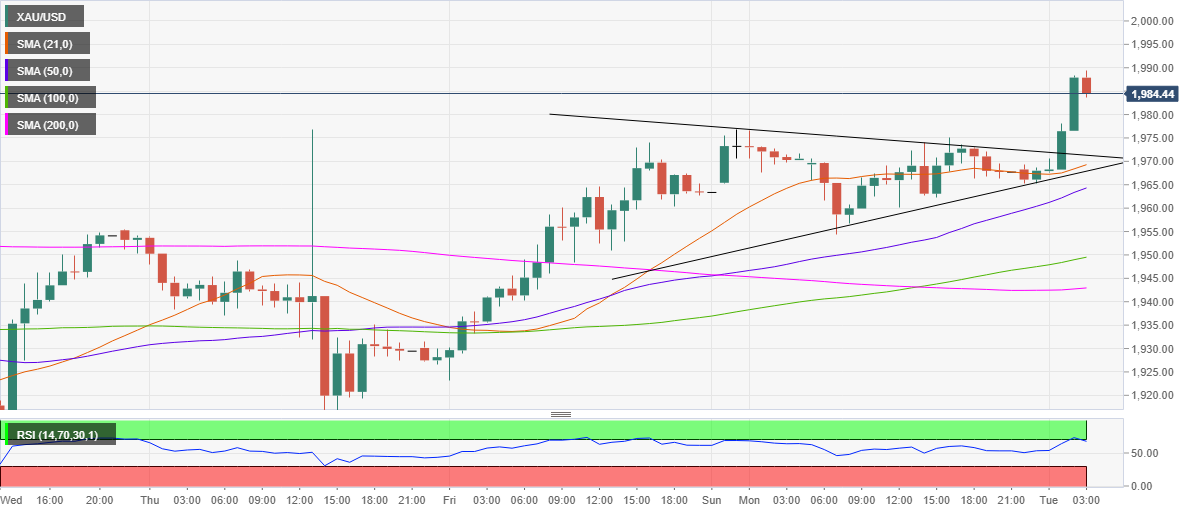
On the hourly chart, Gold has displayed a pennant breakout, having closed the hour above the falling trendline (pattern) resistance at $1972.
The bullish breakout triggered a sharp rally towards the $1990 mark, especially after the price pierced above the 21-hourly Simple Moving Average (SMA), then at $1967.50.
Gold now looks to test the pattern target at $1994 en route the critical hurdle at $2000.
The hourly Relative Strength Index (RSI) has reversed from the overbought territory, still remains bullish near the 68 area.
The pattern resistance now support at $1972 will act as the immediate support, below which the $1970 level could be challenged. That level is the confluence of the 21-HMA and the pattern support.
Should the selling pressure accelerate the upward-sloping 50-HMA at $1964 could come into play.
Gold: Additional levels to consider
XAU/USD
| OVERVIEW | |
|---|---|
| Today last price | 1986.20 |
| Today Daily Change | 17.40 |
| Today Daily Change % | 0.88 |
| Today daily open | 1967.8 |
| TRENDS | |
|---|---|
| Daily SMA20 | 1969.33 |
| Daily SMA50 | 1889 |
| Daily SMA100 | 1803.35 |
| Daily SMA200 | 1681.11 |
| LEVELS | |
|---|---|
| Previous Daily High | 1976.76 |
| Previous Daily Low | 1954.37 |
| Previous Weekly High | 1976.79 |
| Previous Weekly Low | 1902.76 |
| Previous Monthly High | 2075.32 |
| Previous Monthly Low | 1863.24 |
| Daily Fibonacci 38.2% | 1968.21 |
| Daily Fibonacci 61.8% | 1962.92 |
| Daily Pivot Point S1 | 1955.86 |
| Daily Pivot Point S2 | 1943.92 |
| Daily Pivot Point S3 | 1933.47 |
| Daily Pivot Point R1 | 1978.25 |
| Daily Pivot Point R2 | 1988.7 |
| Daily Pivot Point R3 | 2000.64 |


