GBP/USD: Predicting A Sell-Off
GBP/USD: Predicting a sell-off
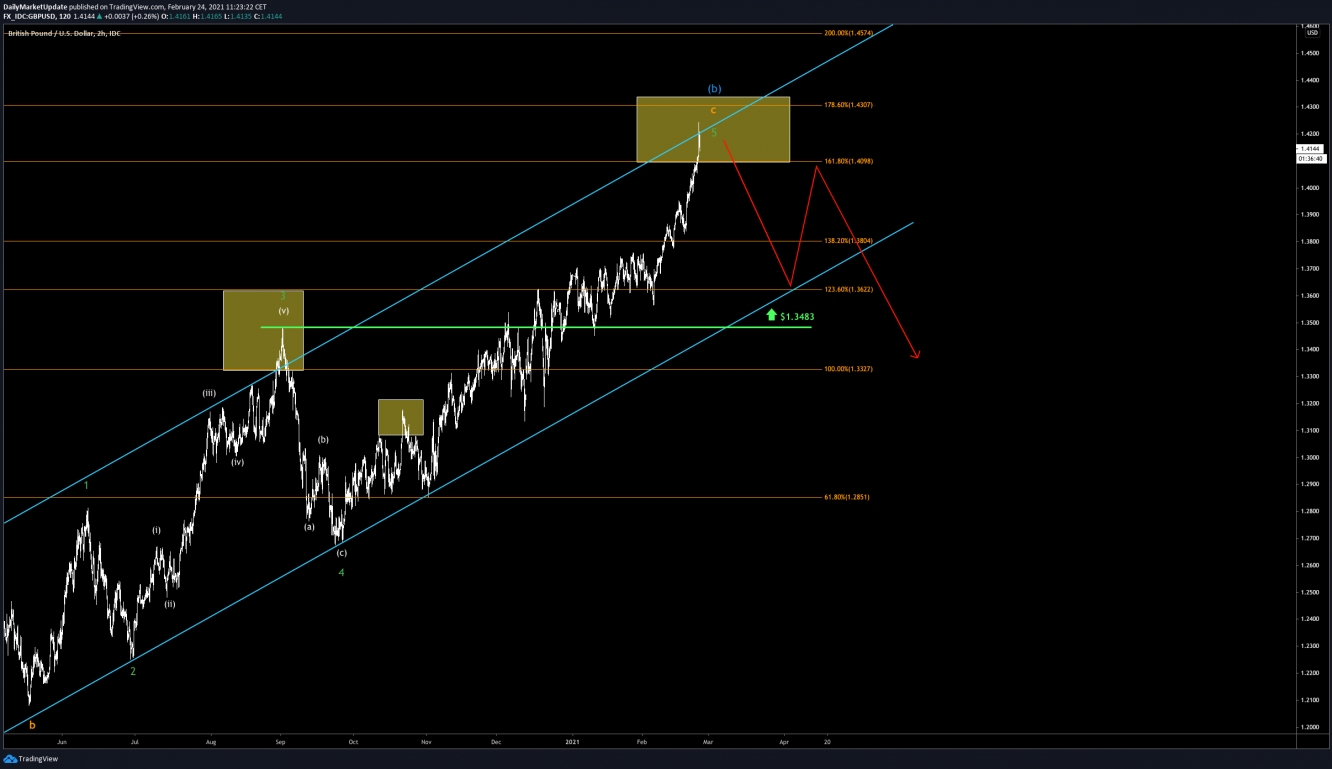
Some time ago, we predicted that the British Pound (GBP) would arrive in the area around $1.40, and we are finally there! The bulls are strong enough to get to this significant mark, and we have gloriously approached the indicated trading area. We expect a bearish decline from the corridor's upper trendline that we have indicated in the chart, which would mean prices around $1.425. We predict that the bears will pull the price down towards the lower trendline of the corridor from this area. If the indicators allow it, we will go short quite soon, as we expect a longer downward trend to set in the mid-term. Why did we not outline a long trade pointing towards the trading zone? Since there were many overlapping structures in the upward slope, it wasn't easy to enter trades with suitable stops. The risk, hence, was too great to bear in the upward trend, and we opted not to enter a long position here.
For those who don't want to wait for our technical indicators to align:
There is a short opportunity in the GBP/USD, as our chart indicates. A stop-loss above $1.434 would be our advice for those of you who want to make this trade.
GBP/USD - 2hour Chart
(Click on image to enlarge)


