
GBP/USD Elliott Wave Forecast For Thursday, May 31
GBP/USD Elliott Wave Forecast in 15 Minutes chart
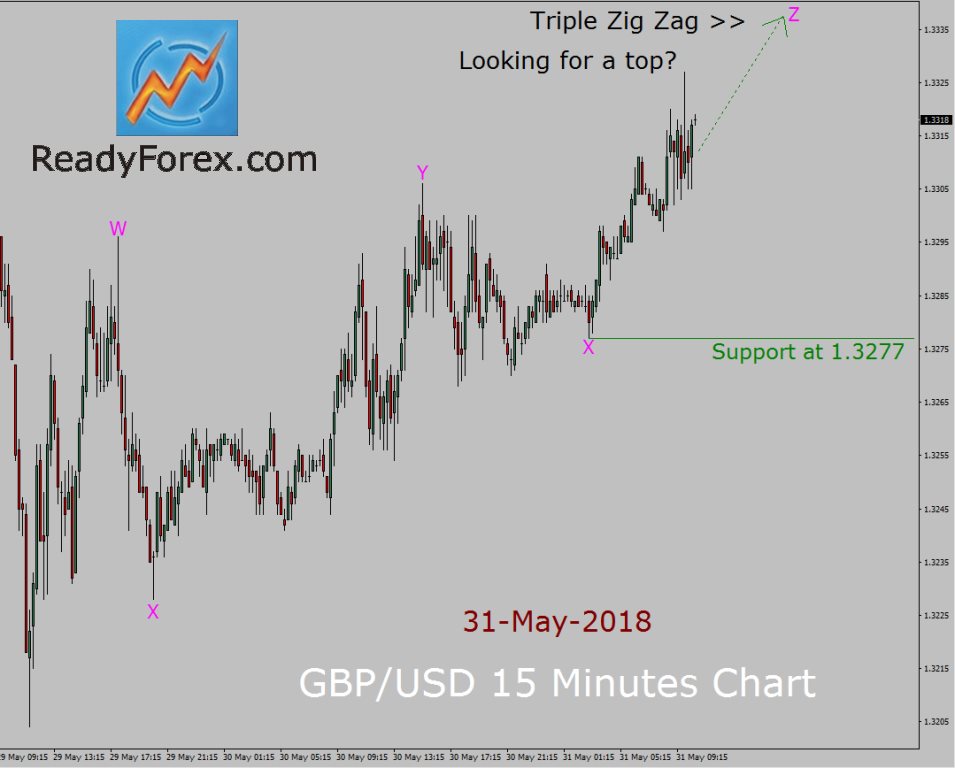
A bullish trend is present in GBP/USD currency pair, 15 minutes chart. The price of GBP/USD currency pair is going to rise up now on a short-term basis to create a Bullish Corrective Elliott wave pattern and Forex traders should consider taking a possible buy trading chance.
A strong key support level is present at 1.3277 price level which is the termination point of Bearish Corrective wave X leg. In my opinion, price action in GBP/USD currency pair has not completed bullish wave Z corrective Elliott wave pattern. So, based on Elliott wave forecast, Bullish corrective wave Z leg is going to move price up, towards 1.3340 price area in coming trading hours.
Next, the price action is most likely going to prints a top as well in coming trading hours after completing bullish corrective wave Z pattern. As the trend is still bullish, Forex traders should consider only long trades and no trade against the current GBP/USD bullish trend as it is always easy to trade in the favour of market trend. Currently, bullish wave Z leg which is part of the Triple Zig Zag corrective Elliott wave pattern looks half finish. A good idea is to look for a possible buy trading chance to join an up trend around 1.3318 price area.
However; if the price action in GBP/USD spot Forex pair breaks below 1.3277 important support level then Bullish Elliott wave forecast will become in-valid. From this time forward, I may seize the opportunity to stay out of the market and re-assess the GBP/USD currency pair price movement in fifteen minutes chart.
(Click on image to enlarge)
Disclaimer: Forex trading involves significant risk of loss. The high degree of leverage can work against you as well as for you. The possibility exists that you could sustain a loss of some or all ...
more

