
FX Is Getting REAL In Brazil
In this week’s Dirty Dozen [CHART PACK] we walk through monthly charts, update the internals picture, look at retail positioning in stocks, talk about the big breakout in USDBRL, and more.
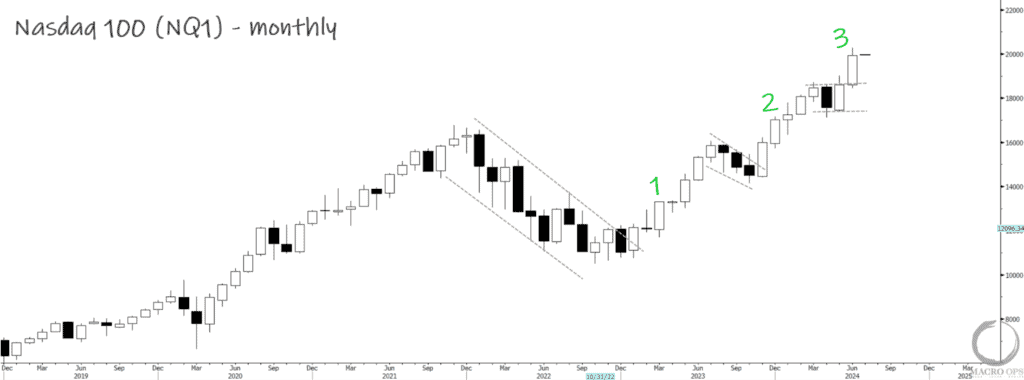
1. Friday was the last trading day of the month, giving us new monthly charts to scroll through over the weekend. Pulling back and looking at these longer timeframes on a bar-by-bar basis helps to keep us from getting treed by a chihuahua and riding the big trends.
On that note, the Qs closed strong with the bulls still firmly in control. They’re in a primary bull trend and are two months into the third bull leg (trends typically move in three legs). The path of least resistance remains up.
(Click on image to enlarge)
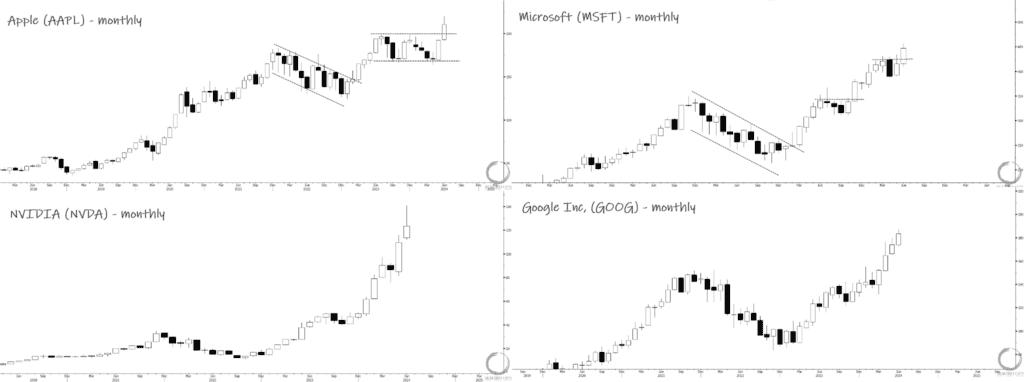
2. And it’s hard for the bears to eat when the companies that dominate the indices are breaking out to or closing at new all-time highs, as each of the Fab 4 below did last month.
(Click on image to enlarge)
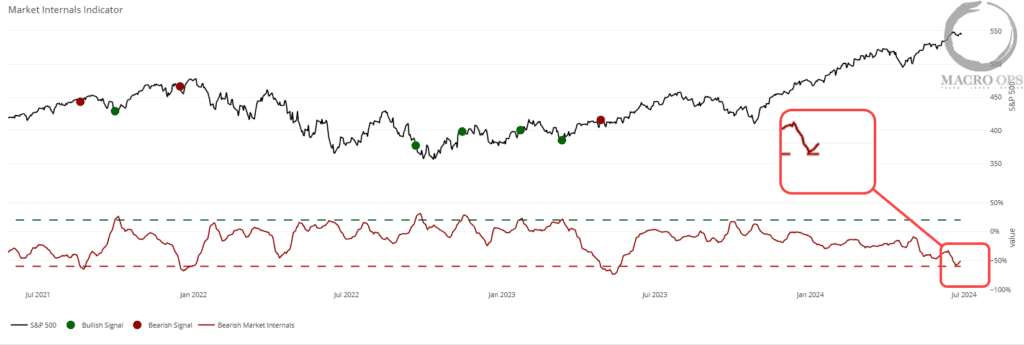
3. Our Market Internals Aggregator avoided triggering the sell signal we talked about last week. Hopefully, we see it turn up from here but we’ll need to continue to keep an eye on this.
(Click on image to enlarge)
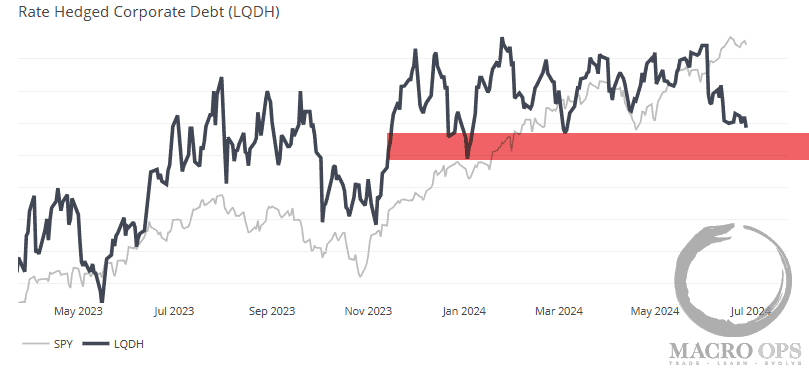
4. A negative divergence below the red zone in LQD/IEF would point to a likely shakeout in the broader market ahead.
(Click on image to enlarge)
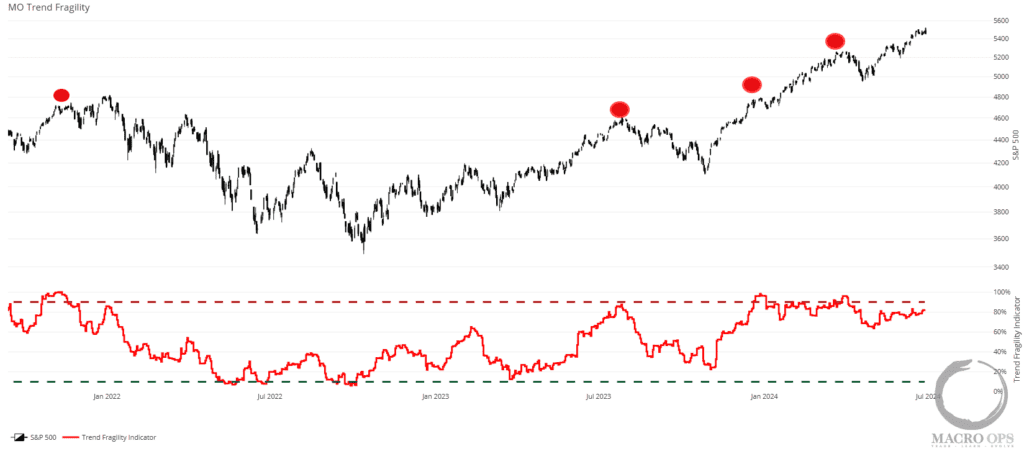
5. Our Trend Fragility indicator, a composite of sentiment and positioning data points, is slowly climbing higher and now sits at 83%. A move above 90% (red dots) would trigger a sell signal.
(Click on image to enlarge)
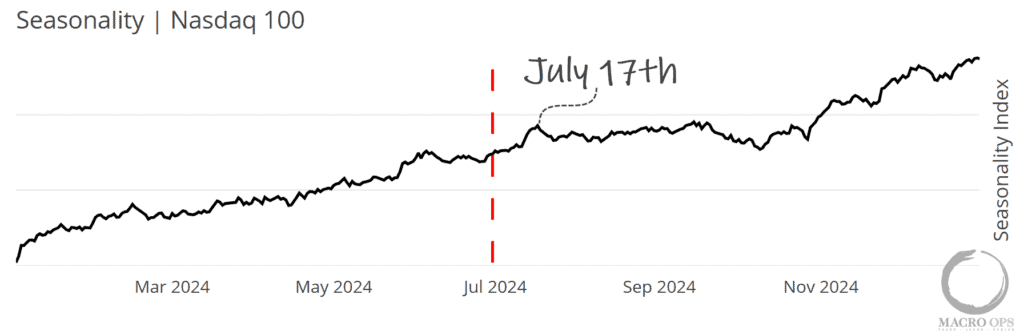
6. We’re moving into a period of strong seasonality for both the Nasdaq and SPX. Where both indices tend to see strong gains in the first two weeks of July.
(Click on image to enlarge)
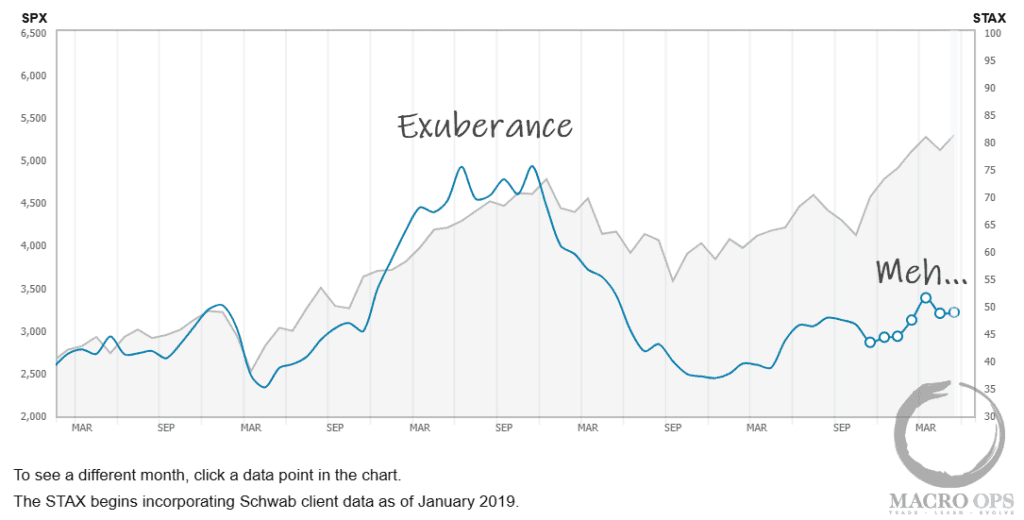
7. Schwab’s STAX index, which replaced TD Ameritrade’s IMX following their merger, is a monthly sentiment/positioning indicator based on the activity of millions of retail investor accounts. The index climbed as high as 77 in 21’ but sits now at only 48, showing a lack of the type of exuberance that tends to mark large tops.
(Click on image to enlarge)
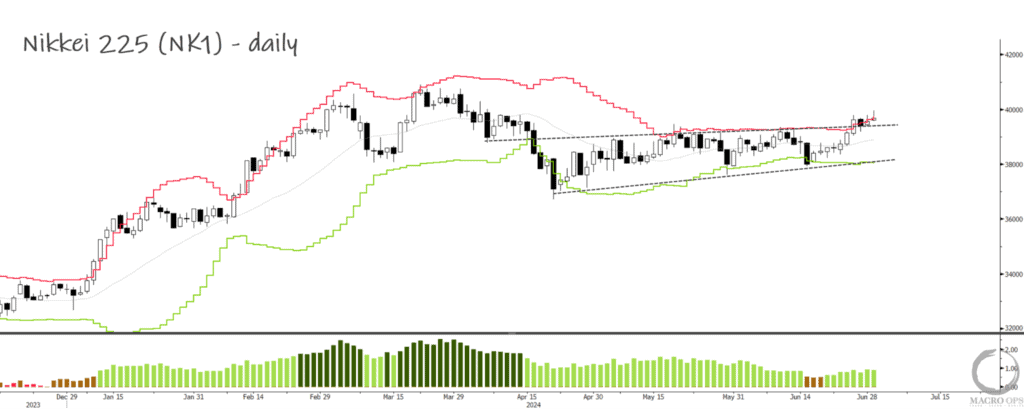
8. The Nikkei 225 has been correcting sideways for the past three months and is wedging on the monthly and weekly charts.
(Click on image to enlarge)
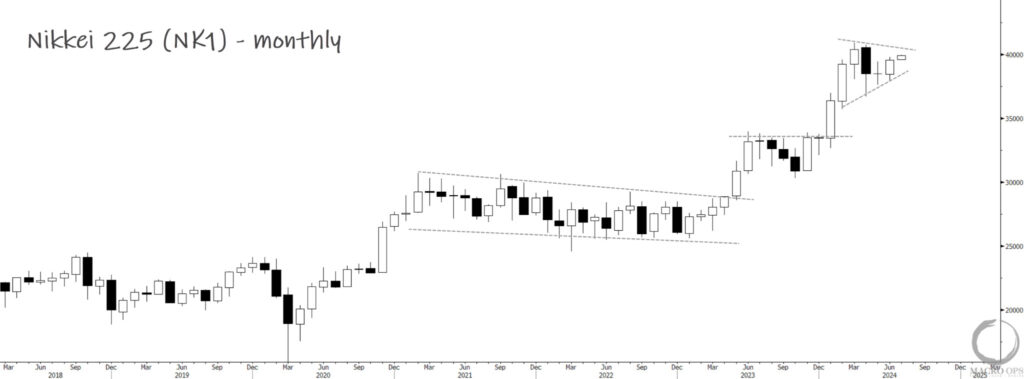
9. We’re going to watch to see how it trades over the next few days and whether it can hold its recent breakout. If it can maintain a decent bid we’ll get long.
(Click on image to enlarge)
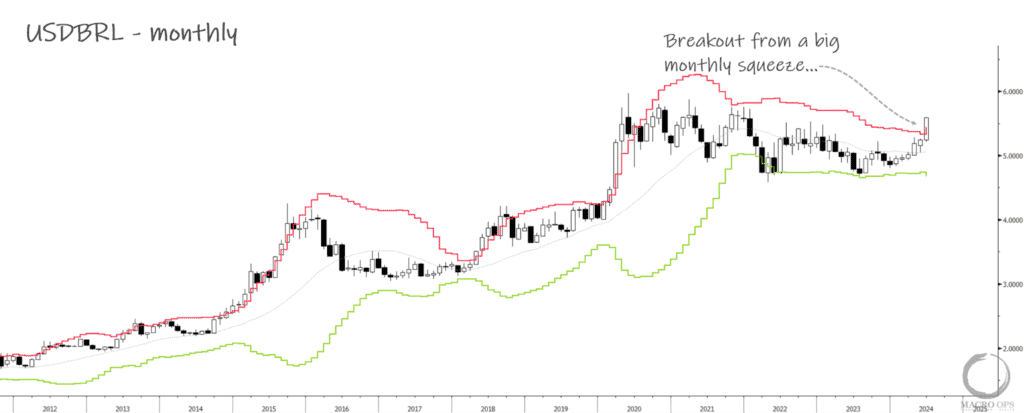
10. The USDBRL is breaking out of a 4yr+ compression regime. That means there’s a LOT of coiled energy for a move higher.
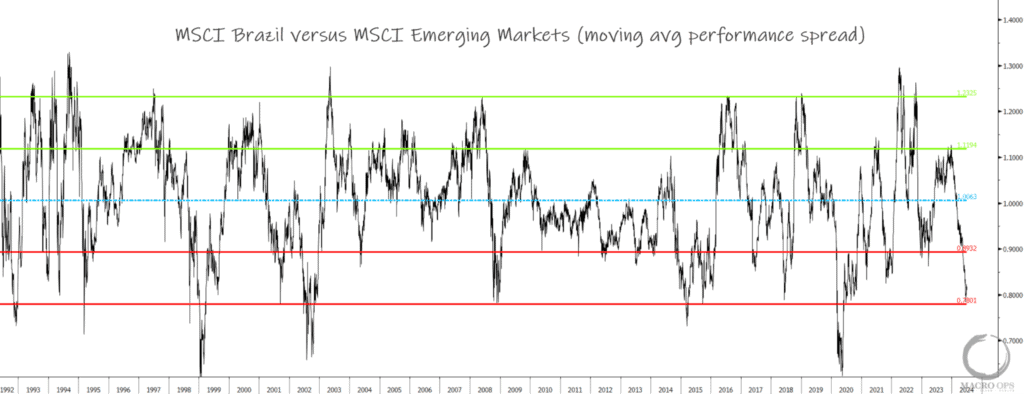
11. Interestingly, Brazilian relative equity performance against emerging markets is nearing extremes.
(Click on image to enlarge)
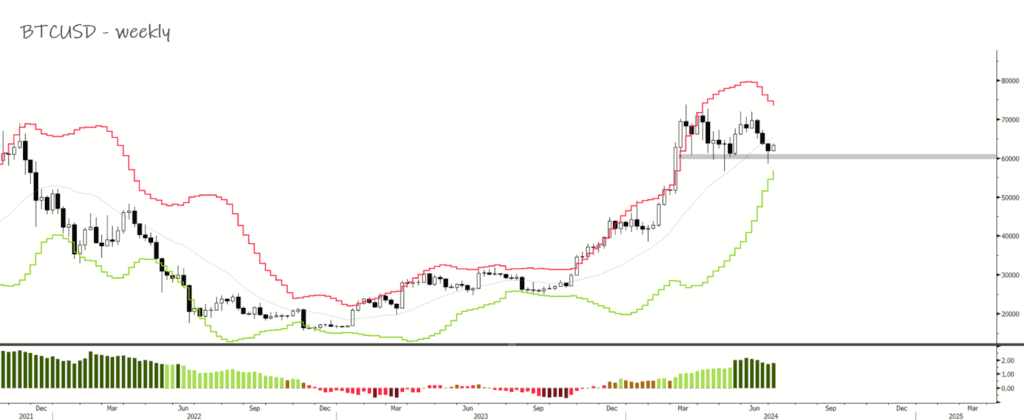
12. BTCUSD’s chart put in a nice reversal candle on the weekly, holding the key 60k level. Both BTC and ETH look like they’re gearing up for another leg higher after correcting sideways for the past four months. The bottom of this range offers a nice technical inflection point to buy/add with tight stops.
(Click on image to enlarge)
More By This Author:
The Fed Is Behind The Curve…
The USD Is In A Major Squeeze…
A Big Move Is Brewing In Crude…
Disclaimer: All statements are solely opinions and are for educational purposes only.


