
Fed Meeting Preview: US Dollar Hinges On Guidance From Powell
The US Dollar will likely be front and center on FX trader radars over the next 24-hours. This is considering high-impact even risk facing USD price action due to the Federal Reserve announcement scheduled to cross-market wires this Wednesday, 16 September at 18:00 GMT. Periodic Fed meetings tend to leave the US Dollar vulnerable owing to heightened potential for outsized moves. FOMC officials are expected to reveal updated economic projections (SEPs) tomorrow and Chair Jerome Powell will hold a press conference shortly after the press statement release.
SUMMARY OF ECONOMIC PROJECTIONS FROM THE JUNE 2020 FOMC MEETING
(Click on image to enlarge)
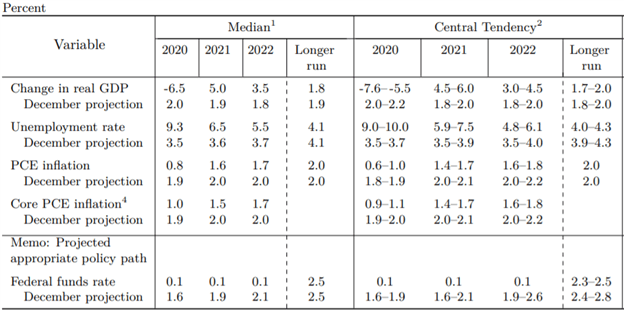
Chart Source: Federal Reserve
The FOMC is likely to reiterate the status quo of loose monetary policy and accommodative financial conditions, but US Dollar currency volatility could accelerate if guidance changes materially. In addition to the headline interest rate decision and SEPs, market participants might emphasize commentary on average inflation targeting (AIT) and yield curve control (YCC), which may weigh notably on the US Dollar as well.
US DOLLAR INDEX PRICE CHART: DAILY TIME FRAME (13 JUL TO 15 SEP 2020)
(Click on image to enlarge)

Chart created by @RichDvorakFX with TradingView
Headed into the upcoming Fed decision, the US Dollar Index (DXY) appears pinned between technical support and resistance roughly around the 92.75 and 93.35 price levels, respectively. A topside breakout could bring the 01 August intraday swing high into the focus whereas a breakout to the downside could entice US Dollar bears to set their sights on fresh two-year lows.
USD PRICE OUTLOOK - US DOLLAR IMPLIED VOLATILITY TRADING RANGES (OVERNIGHT)
(Click on image to enlarge)
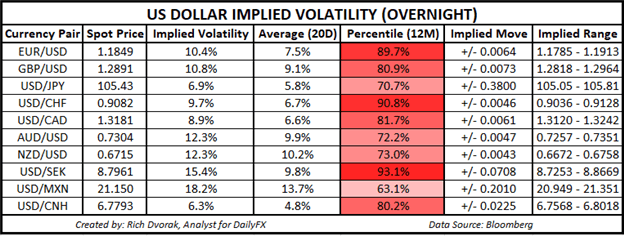
The S&P 500 VIX Index, or fear-gauge, has the potential to serve as a bellwether for US Dollar direction due to the generally strong positive relationship held between the two anti-risk assets. Options-implied trading ranges are calculated using 1-standard deviation (i.e. 68% statistical probability price action is contained within the implied trading range over the specified time frame). In other words, options-implied trading ranges of technical support and resistance outlined above are estimated to contain spot price action 68% of the time.


