

Image Source: Pixabay
- EUR/USD weakens to 1.0775 on the firmer USD on Friday.
- The pair keeps the bearish vibe below the key EMA on the daily timeframe.
- The key resistance level will emerge in the 1.0790–1.0800 zone; the first downside target is located at 1.0724.
The EUR/USD pair trades on a softer note near 1.0775 during the early European hours on Friday. The downtick of the major pair is supported by the renewed US Dollar (USD) demand amid hawkish comments from Federal Reserve (Fed) officials. Later on Friday, the US Michigan Consumer Sentiment Index for May will be released, which is projected to drop from 77.2 in April to 76.0 in May.
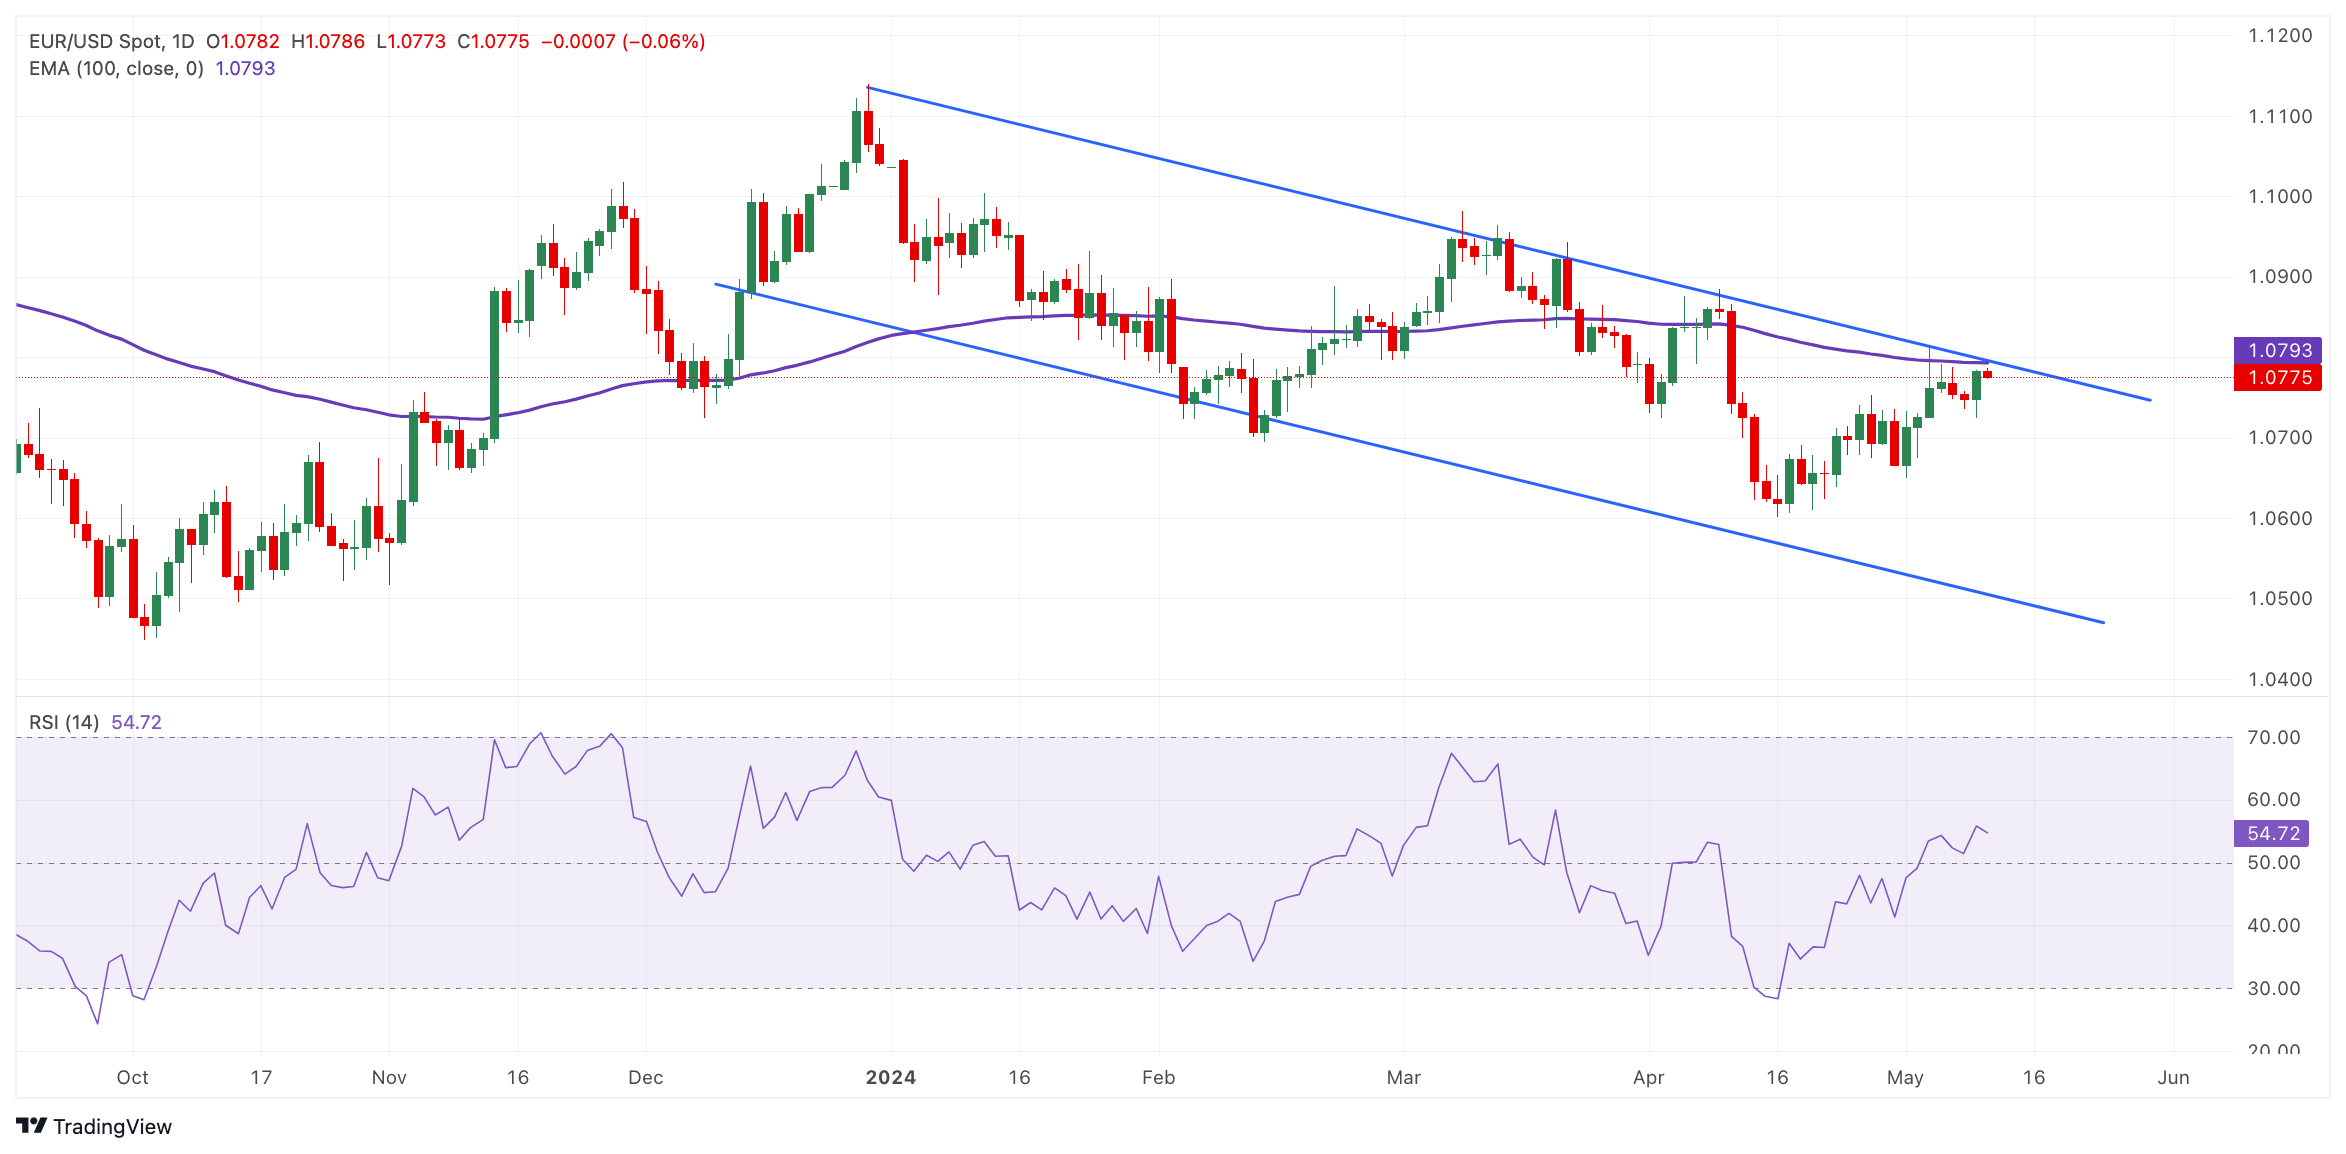
According to the daily chart, EUR/USD has traded within a descending trend channel since mid-December 2023. The bearish outlook of the major pair remains intact, as it is below the key 100-period Exponential Moving Average (EMA). However, the 14-day Relative Strength Index (RSI) stands in bullish territory around 55, indicating that further upside cannot be ruled out.
The key resistance level for EUR/USD will emerge at the 1.0790–1.0800 region, portraying the 100-day EMA and the upper boundary of the descending trend channel. The next upside barrier is seen near a high of April 9 at 1.0885. The additional upside filter to watch is a high of March 21 at 1.0943, followed by March 8 at 1.0981, and finally the 1.1000 psychological level.
On the downside, the first downside target is located near a low of May 9 at 1.0724. Extended losses for EUR/USD expose the pair to a low of May 2 at 1.0650, en route to a low of April 16 at 1.0600. A break below this level will see a drop to the lower limit of the descending trend channel at 1.0500.
EUR/USD daily chart
EUR/USD
| OVERVIEW | |
|---|---|
| Today last price | 1.0774 |
| Today Daily Change | -0.0008 |
| Today Daily Change % | -0.07 |
| Today daily open | 1.0782 |
| TRENDS | |
|---|---|
| Daily SMA20 | 1.0699 |
| Daily SMA50 | 1.079 |
| Daily SMA100 | 1.0833 |
| Daily SMA200 | 1.0794 |
| LEVELS | |
|---|---|
| Previous Daily High | 1.0784 |
| Previous Daily Low | 1.0724 |
| Previous Weekly High | 1.0812 |
| Previous Weekly Low | 1.065 |
| Previous Monthly High | 1.0885 |
| Previous Monthly Low | 1.0601 |
| Daily Fibonacci 38.2% | 1.0761 |
| Daily Fibonacci 61.8% | 1.0747 |
| Daily Pivot Point S1 | 1.0742 |
| Daily Pivot Point S2 | 1.0703 |
| Daily Pivot Point S3 | 1.0682 |
| Daily Pivot Point R1 | 1.0803 |
| Daily Pivot Point R2 | 1.0824 |
| Daily Pivot Point R3 | 1.0864 |
More By This Author:
Gold Price Extends The Rally Despite Hawkish FedspeakUSD/CHF Trades On A Positive Note Above 0.9050, Focus On Fed’s Daly’s Speech
EUR/GBP Extends The Rally Above 0.8600, All Eyes On The BoE Rate Decision


Comments
Log in or sign up to join the conversation.