

Image Source: Pixabay
- EUR/USD could test the upper boundary of the symmetrical triangle.
- Breaking above the upper boundary could potentially shift momentum toward a bullish trend.
- A breach below the 14-day EMA at 1.0752 could prompt the pair to test the psychological threshold of 1.0700.
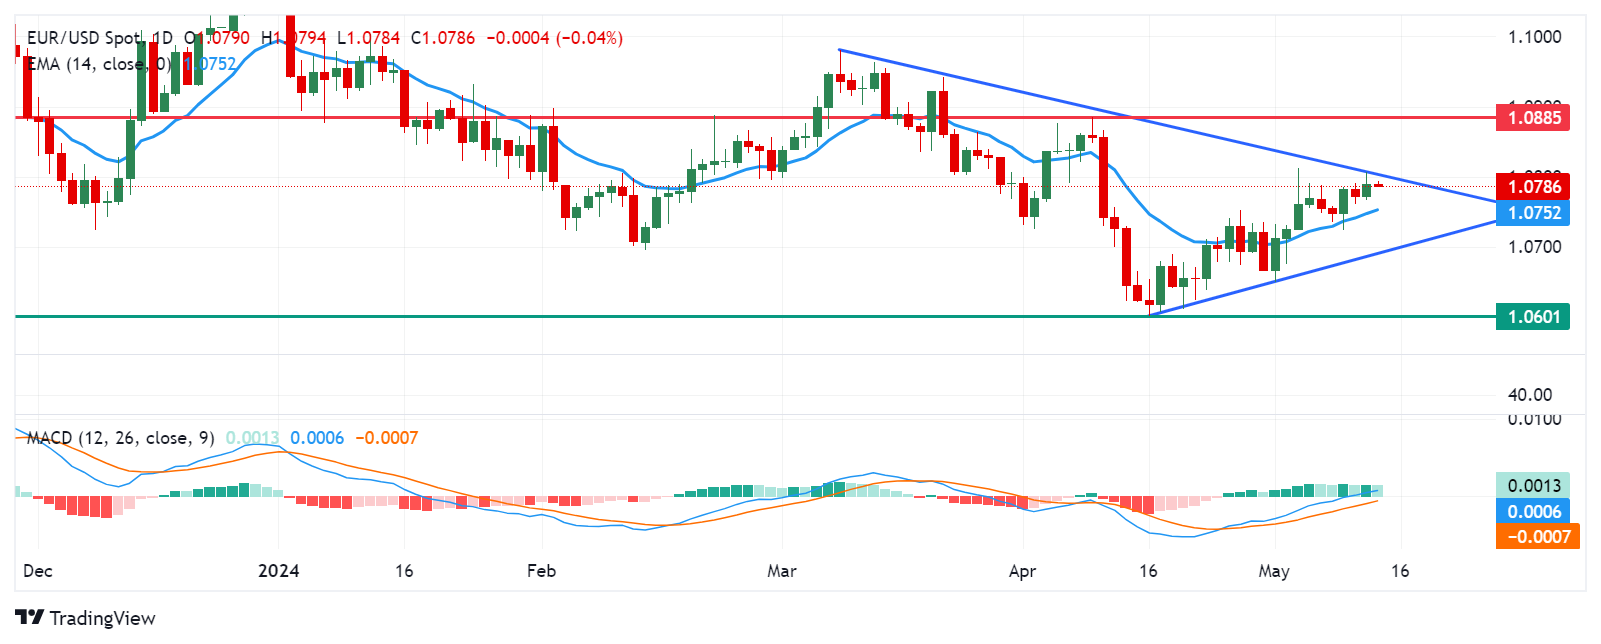
EUR/USD has recovered its recent gains registered in the previous session, trading around 1.0780 during the Asian session on Tuesday. From a technical perspective, analysis indicates a sideways trend for the pair as it continues to lie within the symmetrical triangle. A surpassing of the upper boundary could shift the momentum toward a bullish trend.
However, the momentum indicator Moving Average Convergence Divergence (MACD) indicates an upward momentum for the EUR/USD pair. While it is positioned above the centerline, there is a divergence observed above the signal line. If the signal line crosses over the centerline, it would reinforce the bullish sentiment.
The EUR/USD pair faces an immediate barrier at the upper boundary of the symmetrical triangle aligned with the psychological level of 1.0800. A break above this level could support the pair to test April’s high of 1.0885.
On the downside, key support for the EUR/USD pair is anticipated around the 14-day Exponential Moving Average (EMA) at 1.0752. A break below the latter could lead the pair to navigate the region around the psychological threshold of 1.0700, coinciding with the lower boundary of the symmetrical triangle around the level of 1.0690. Further support levels may emerge around April’s low at 1.0601.
EUR/USD: Daily Chart
EUR/USD
| OVERVIEW | |
|---|---|
| Today last price | 1.0785 |
| Today Daily Change | -0.0005 |
| Today Daily Change % | -0.05 |
| Today daily open | 1.079 |
| TRENDS | |
|---|---|
| Daily SMA20 | 1.0714 |
| Daily SMA50 | 1.0787 |
| Daily SMA100 | 1.0828 |
| Daily SMA200 | 1.0791 |
| LEVELS | |
|---|---|
| Previous Daily High | 1.0807 |
| Previous Daily Low | 1.0766 |
| Previous Weekly High | 1.0791 |
| Previous Weekly Low | 1.0724 |
| Previous Monthly High | 1.0885 |
| Previous Monthly Low | 1.0601 |
| Daily Fibonacci 38.2% | 1.0791 |
| Daily Fibonacci 61.8% | 1.0782 |
| Daily Pivot Point S1 | 1.0768 |
| Daily Pivot Point S2 | 1.0747 |
| Daily Pivot Point S3 | 1.0727 |
| Daily Pivot Point R1 | 1.0809 |
| Daily Pivot Point R2 | 1.0828 |
| Daily Pivot Point R3 | 1.085 |
More By This Author:
USD/CHF Holds Position Above 0.9050 As The US Dollar Remains FirmerUSD/CHF Remains Tepid Near 0.9050 Amid Dovish Sentiment Surrounding The Fed
GBP/USD Rises To Near 1.2540, Driven By Higher UK GDP


Comments
Log in or sign up to join the conversation.