
EUR/USD Bearish Momentum Now Using 1.20 As Resistance Zone
The EUR/USD is clearly breaking the long-term support trend line and daily 21 ema zone. How important is this bearish breakout? And what are the immediate targets? Let’s analyze this.
Price Charts and Technical Analysis
(Click on image to enlarge)
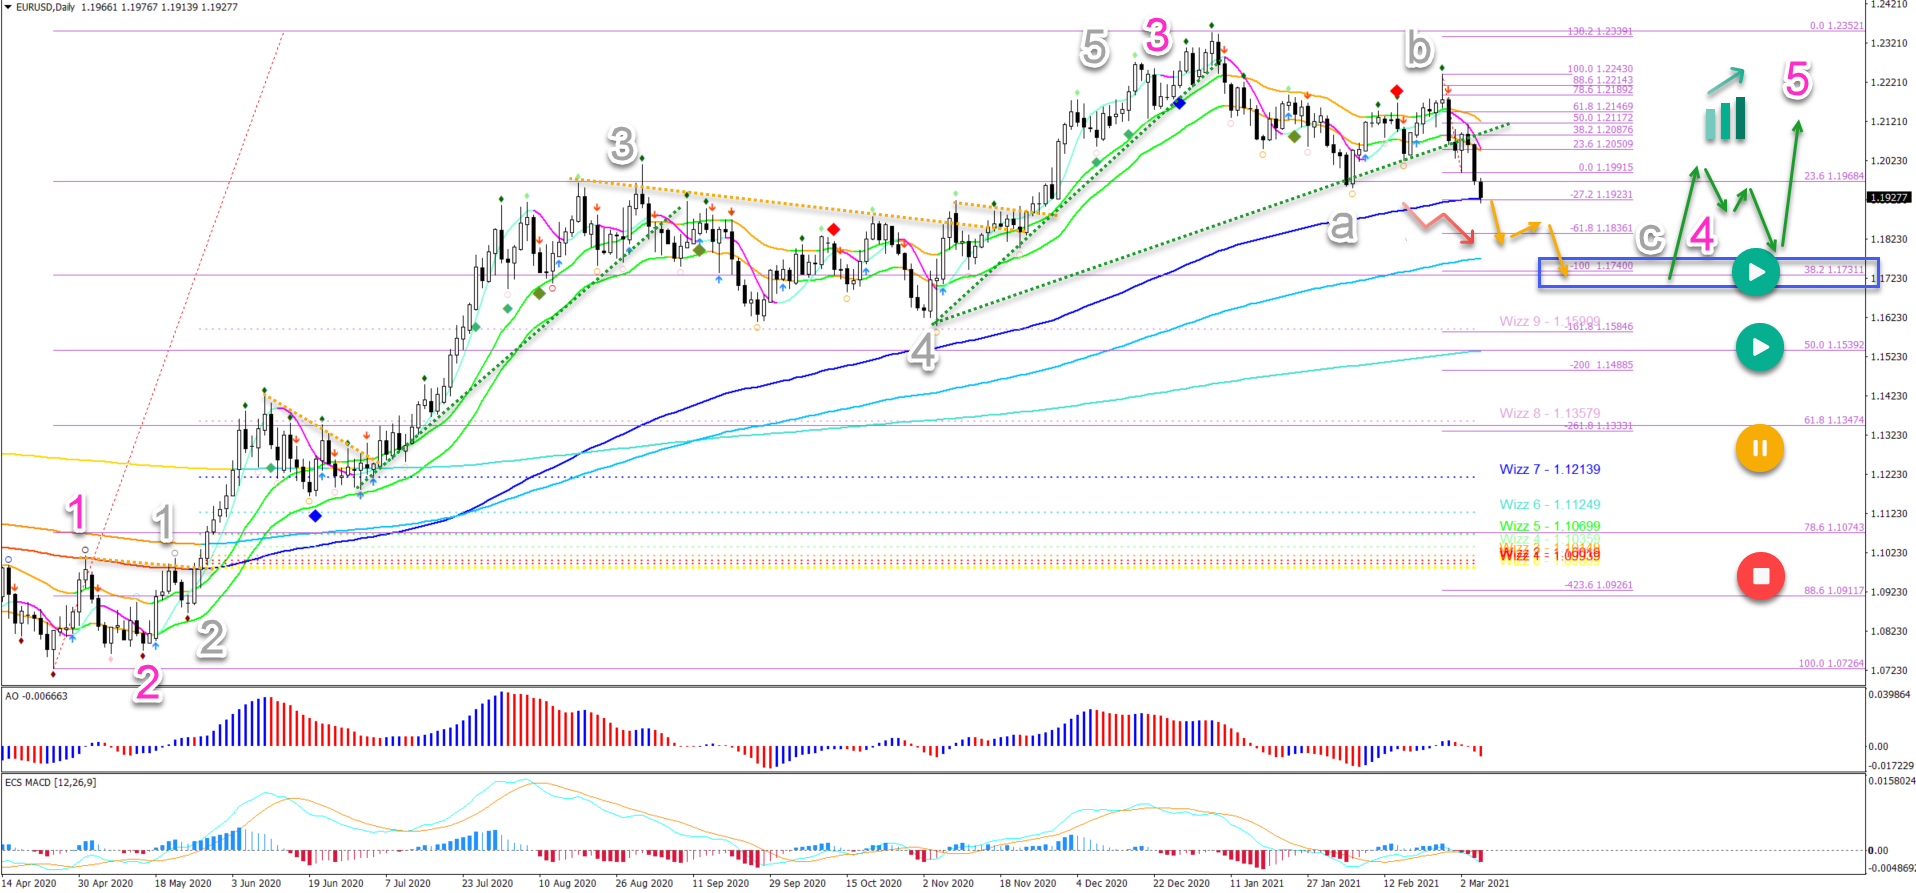
The EUR/USD bearish breakout was already anticipated in our ABC zigzag forecast. The only difference was that wave 2 (orange) on the 1-hour chart ended sooner than expected.
- A downtrend was confirmed with the bearish breakout below the 21 ema zone, 23.6% support Fib, and support lines (dotted green).
- This confirms a new lower low and a bearish price swing. This is probably a wave C (grey) of a larger wave 4 (pink).
- The main target of wave C (grey) is the 38.2% Fibonacci retracement level at 1.1730.
- A bullish bounce (green arrows) at the 38.2% or 50% Fib confirms wave 4 (pink).
- A deeper bearish push places it on hold (yellow circle) or invalidates it (red circle).
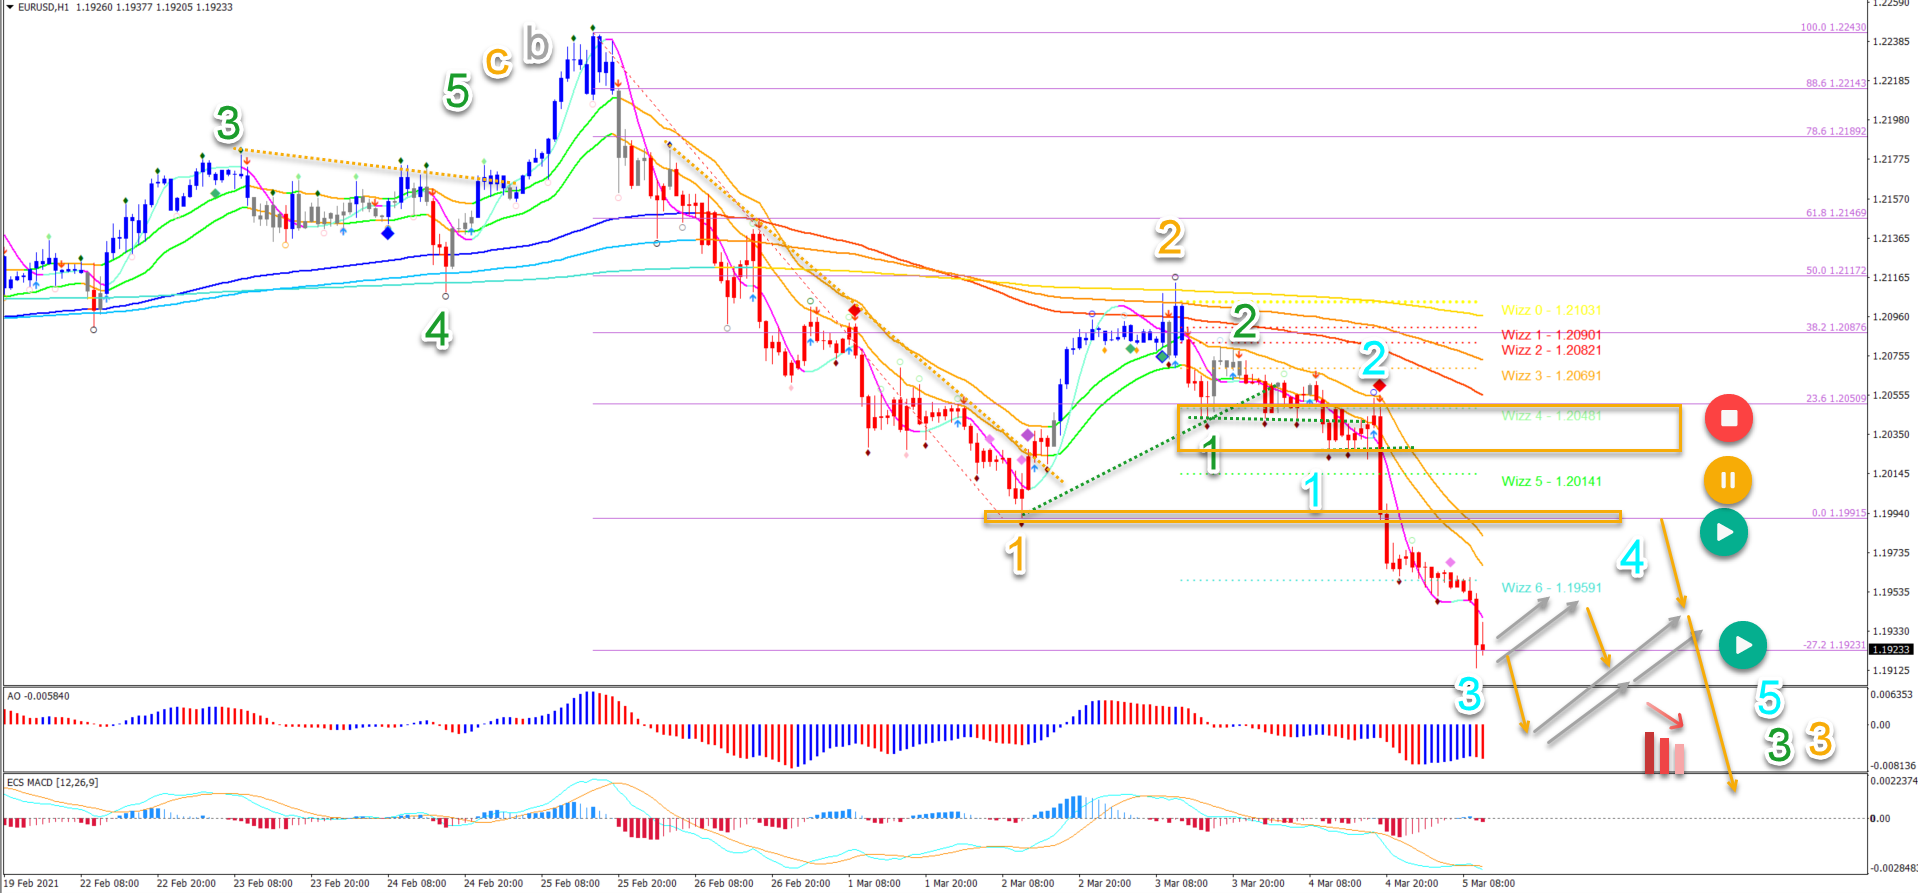
On the 1 hour chart, the price action has reached the -27.2% Fibonacci target. This could create a wave 4 (blue) pullback now or next week.
- The current bearish impulse is typical for wave 3 (blue).
- The pullback should remain shallow. A bearish break confirms the downtrend (orange arrows).
- The intermediate target for wave 3 (green) is 1.1836. The next target zone is at 1.1750.
(Click on image to enlarge)
Disclaimer: The opinions in this article are for informational and educational purposes only and should not be construed as a recommendation to buy or sell the stocks mentioned or to solicit ...
more
How did you like this article? Let us know so we can better customize your reading experience.

Comments
Leave a comment to automatically be entered into
our contest to win a free Echo Show.

